

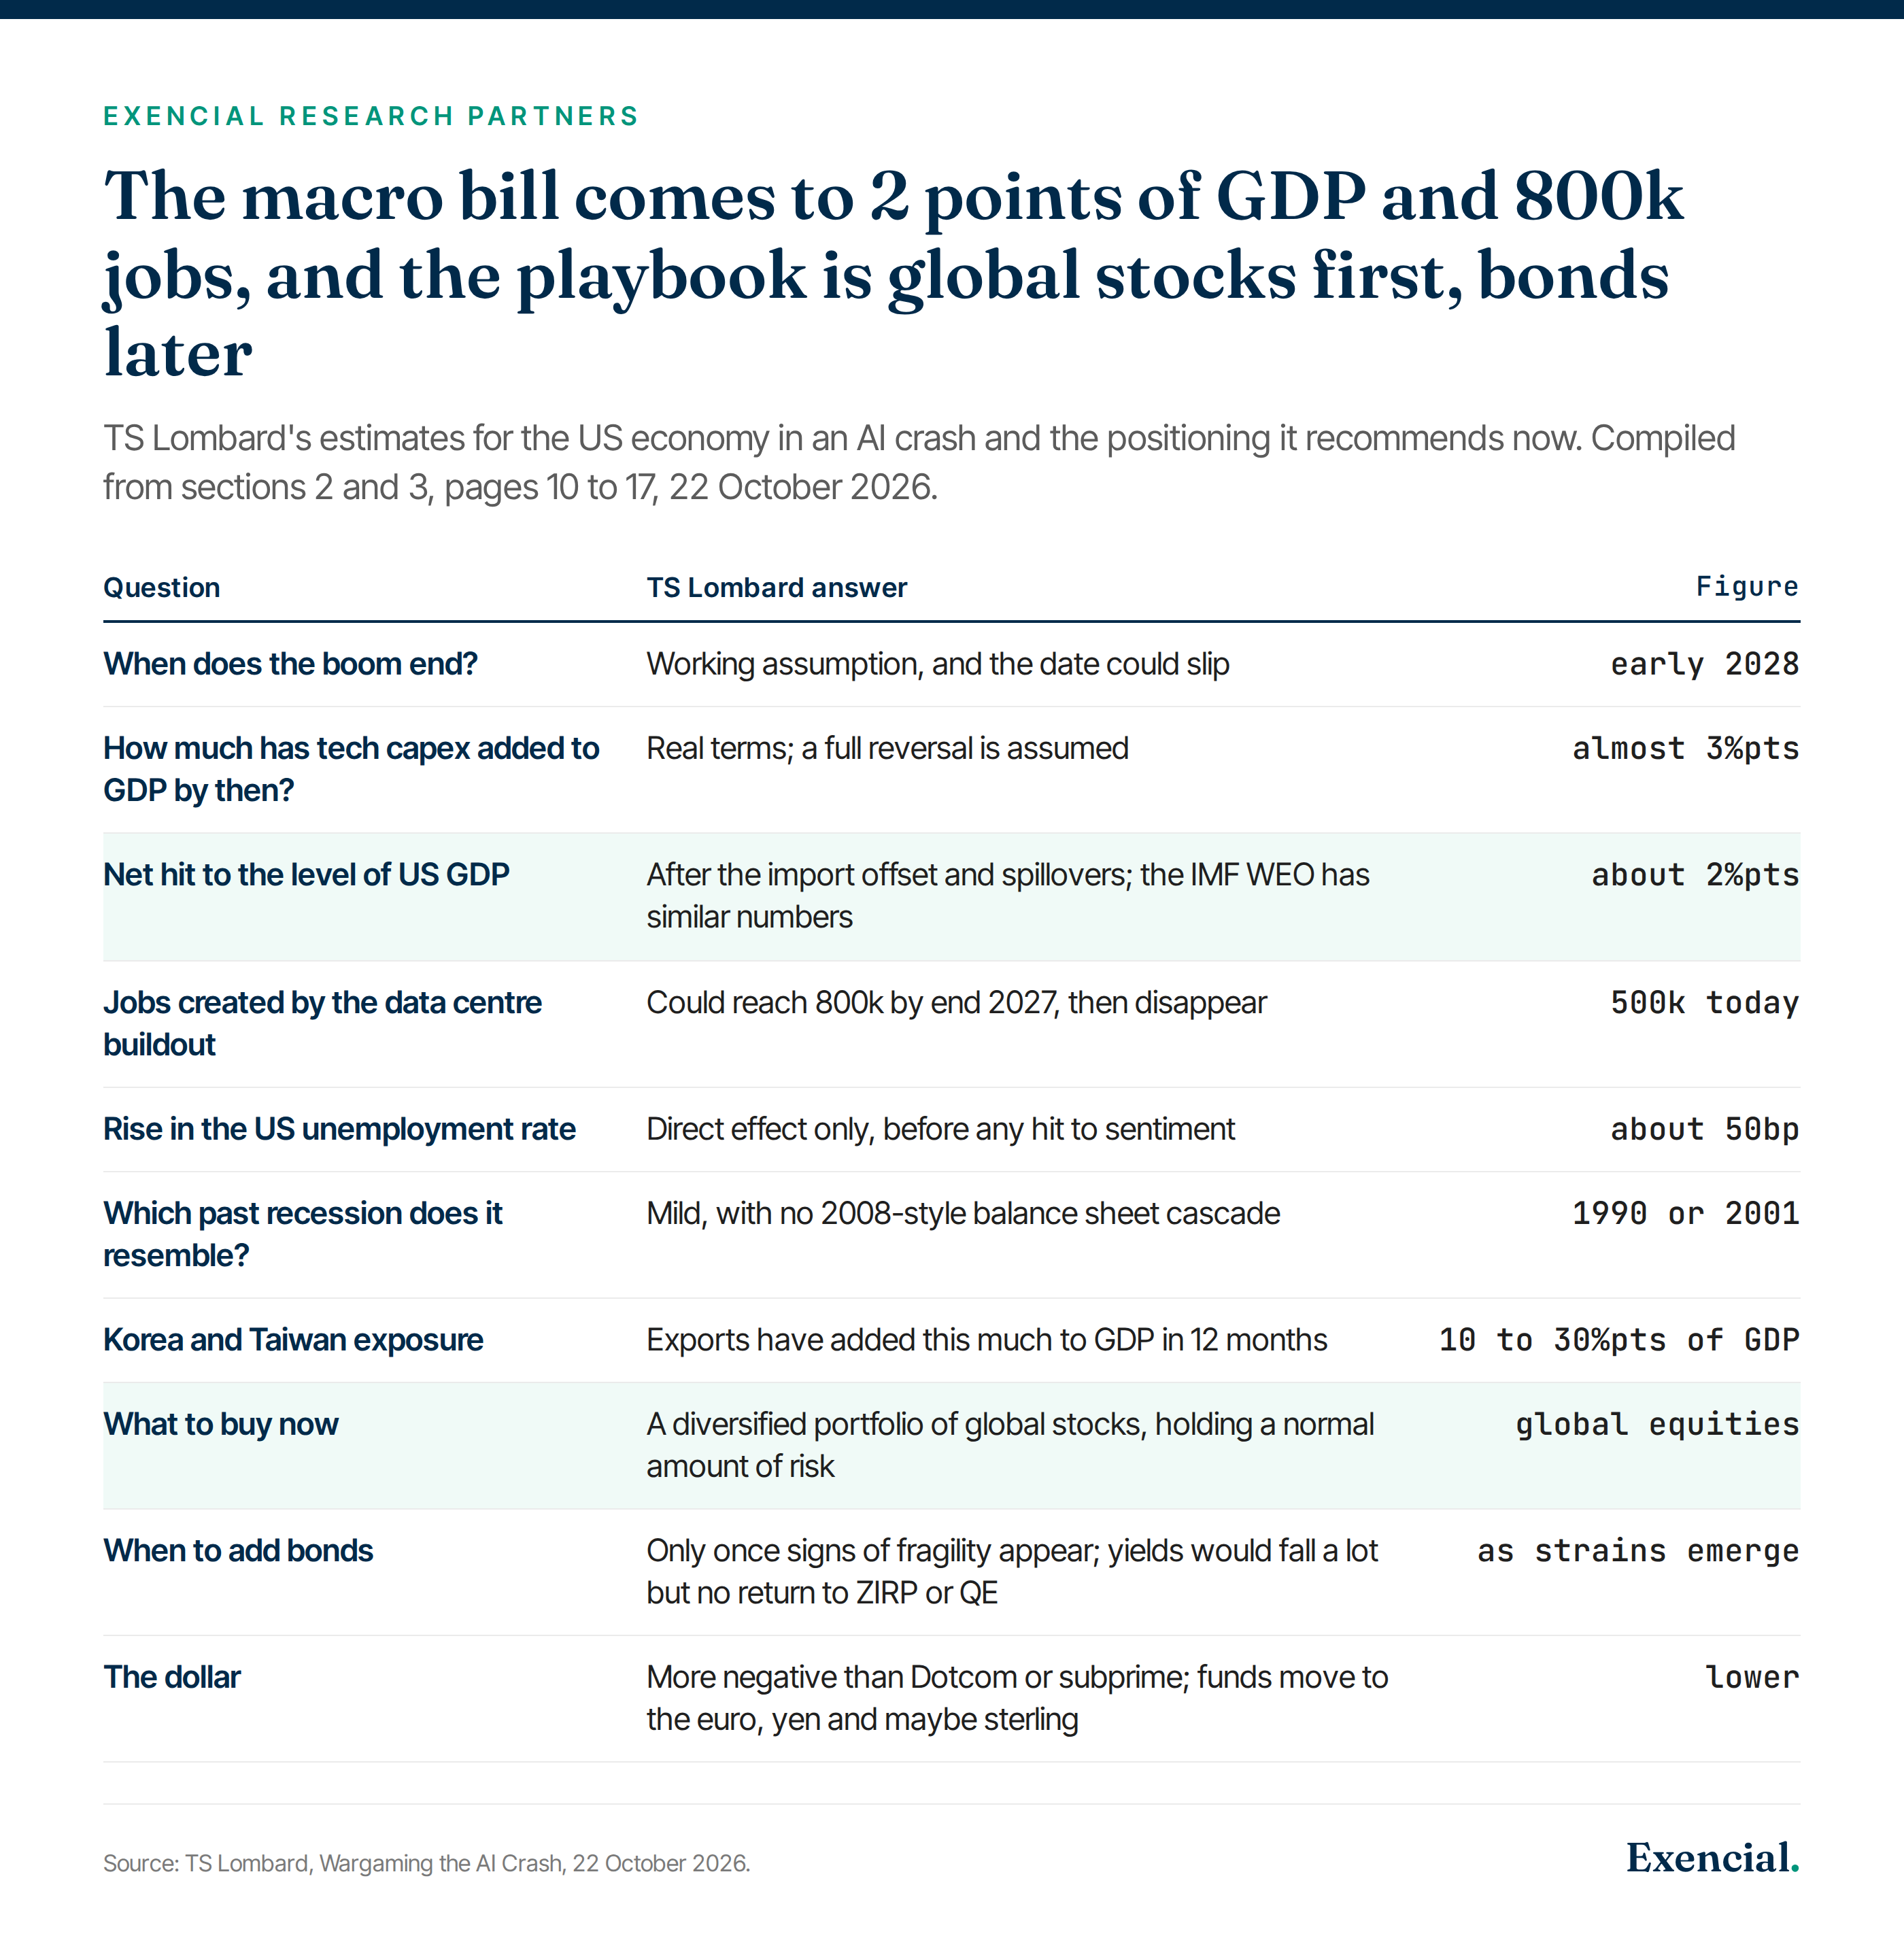
TS Lombard published “Wargaming the AI Crash” on 22 October 2026, written by Dario Perkins, Managing Director for Global Macro. It is a thematic macro note, so there is no rating and no price target. The call is a scenario. If the AI capex boom reverses, TS Lombard assumes the S&P 500 falls 30%, US tech stocks fall 40%, and about $20 trillion of US equity value disappears. Credit losses across AI-related debt come to only $125 to 190 billion. The US recession that follows is mild, on a par with 1990 or 2001. The working date for the turn is early 2028, and the note says that date could slip. The logic is straightforward. Most AI revenue is still capex recycled inside the AI ecosystem, so earnings would fall with capex. But US private debt is low, the import bill shrinks as fast as capex does, and the Fed has about 2 points of real rate to cut.
Why does TS Lombard still call this a bubble four months after its last note?
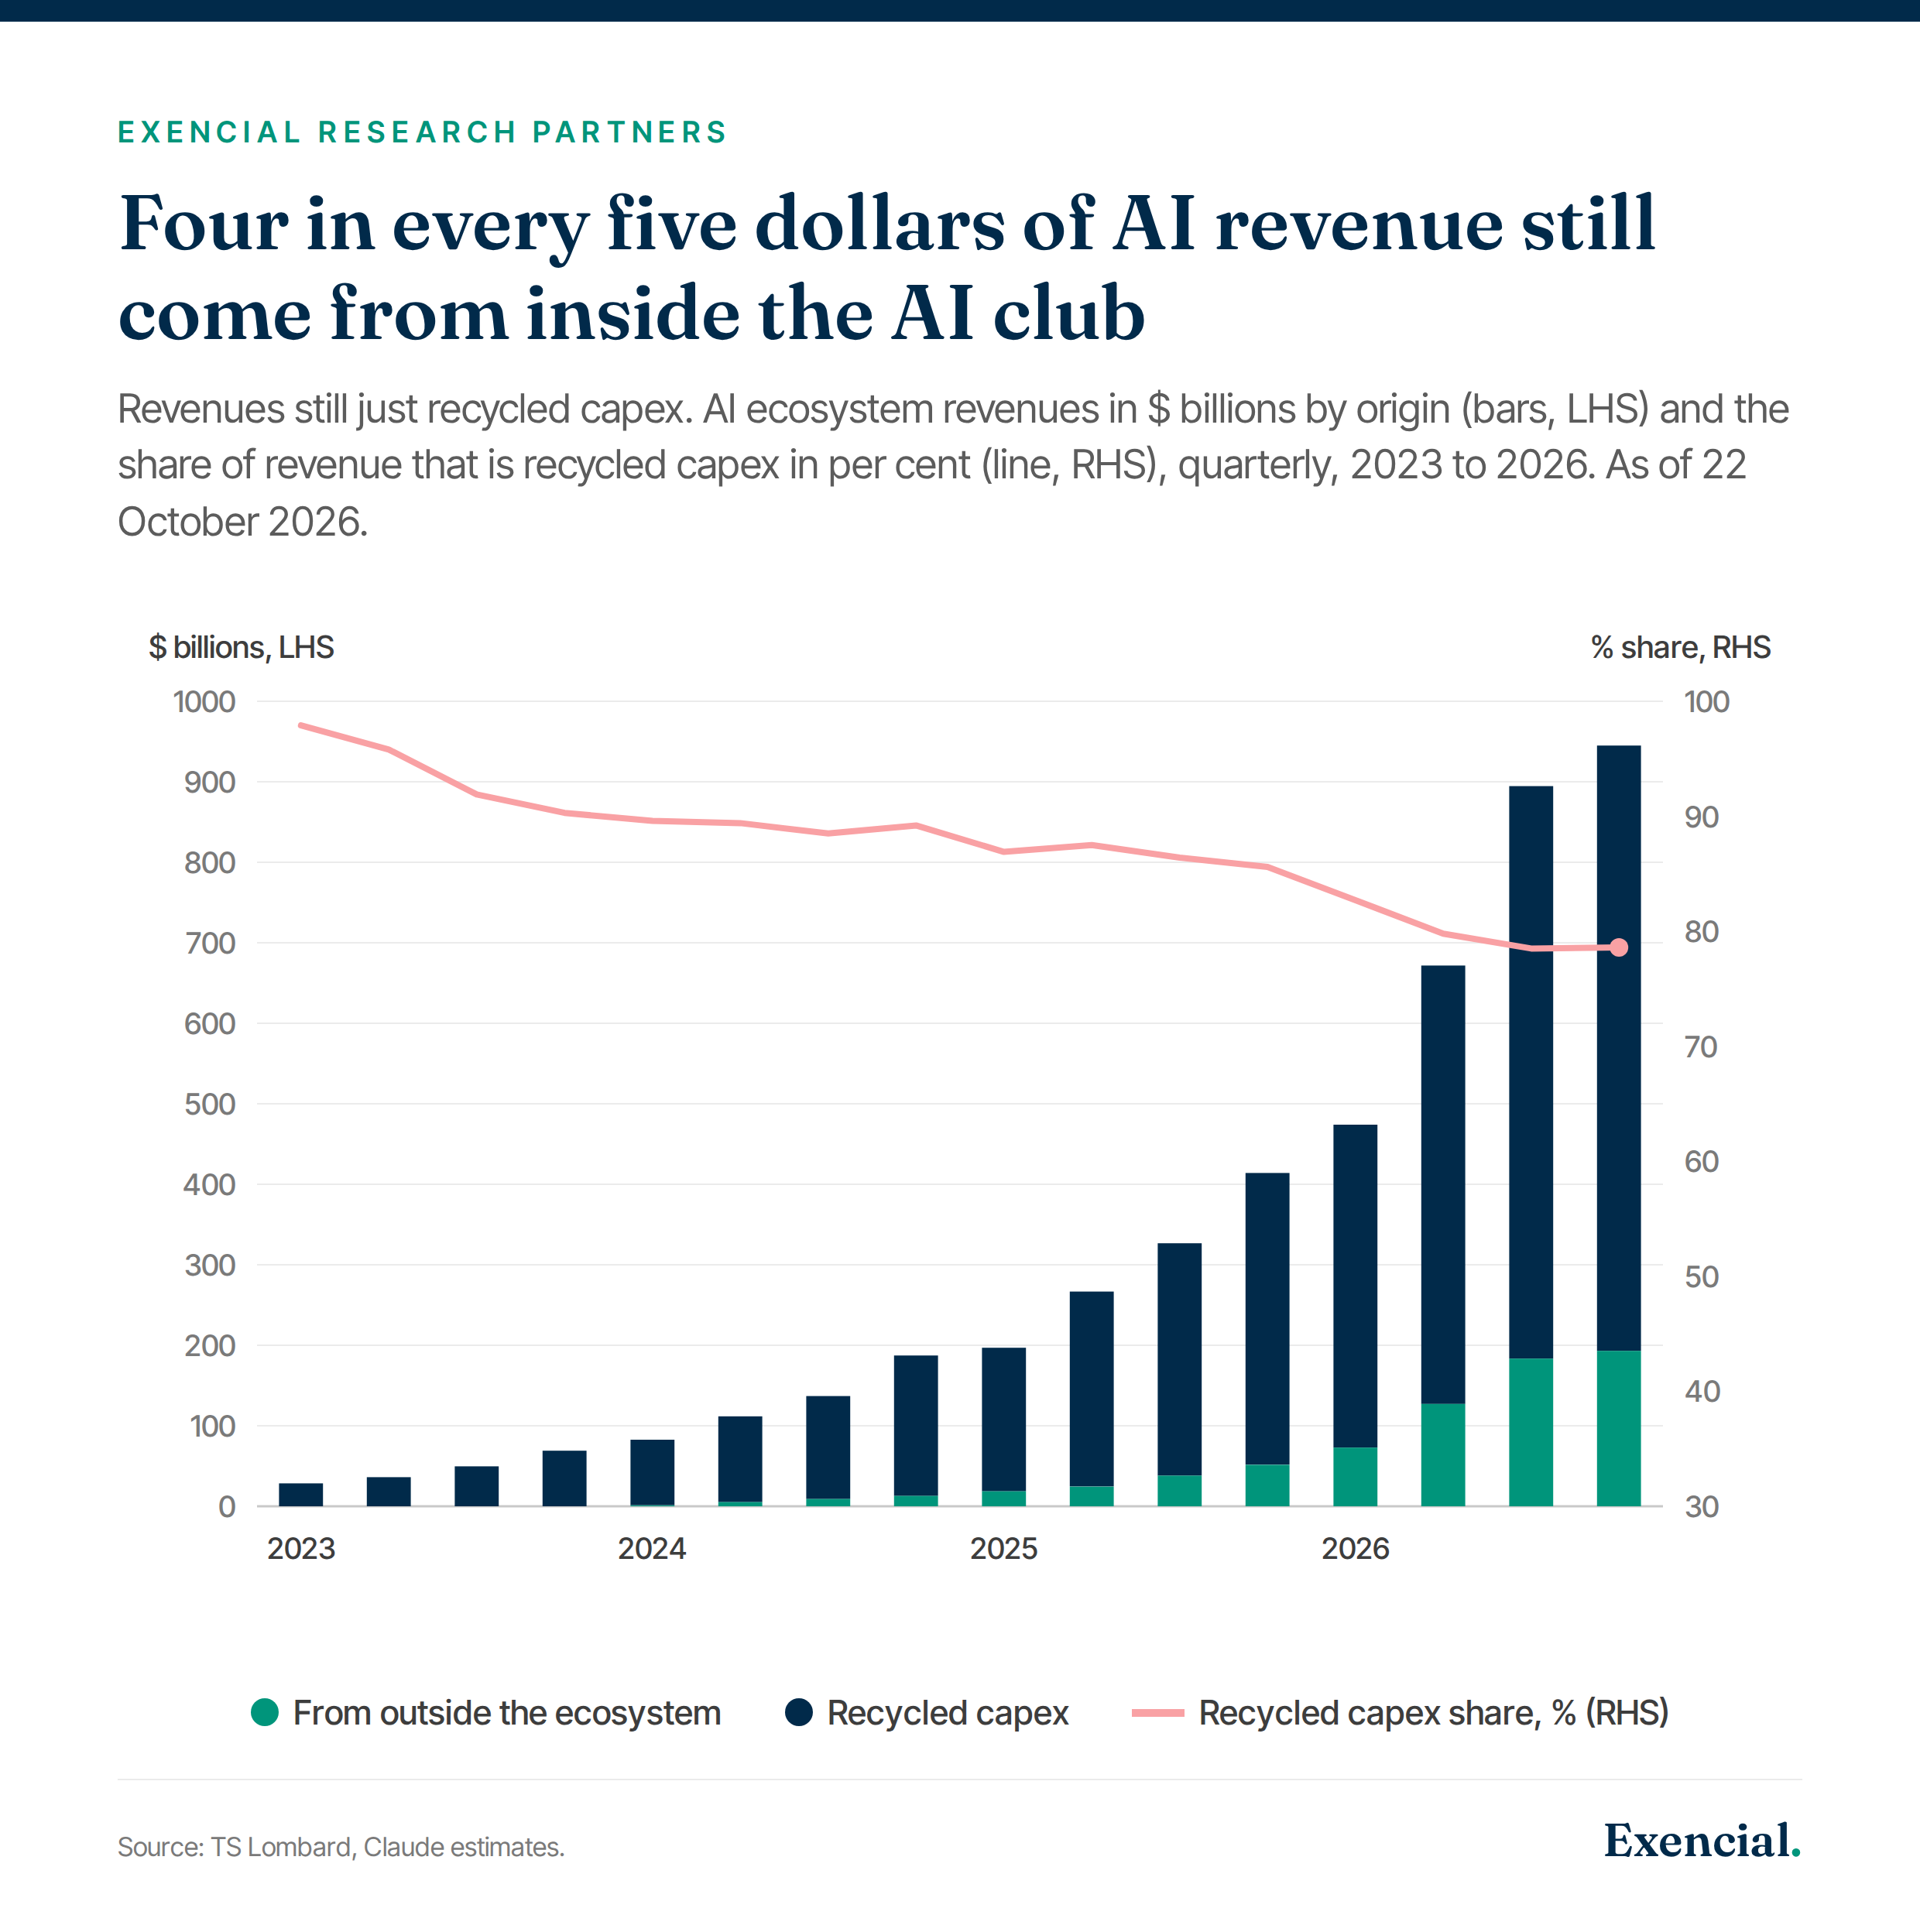
Because the revenue mix has not changed. TS Lombard’s June note argued that AI revenues were growing only because hyperscalers were spending. One company’s capex is another company’s revenue. Four months on, the firm’s sustainability test is the ratio of revenue from inside the ecosystem to revenue from outside it. That ratio is “pretty much the same”. TS Lombard’s own estimate puts AI ecosystem revenues near $950 billion a year by the end of 2026. Roughly four fifths of that is recycled capex, down from 98% in early 2023. Only about $200 billion comes from businesses and consumers outside the AI supply chain.
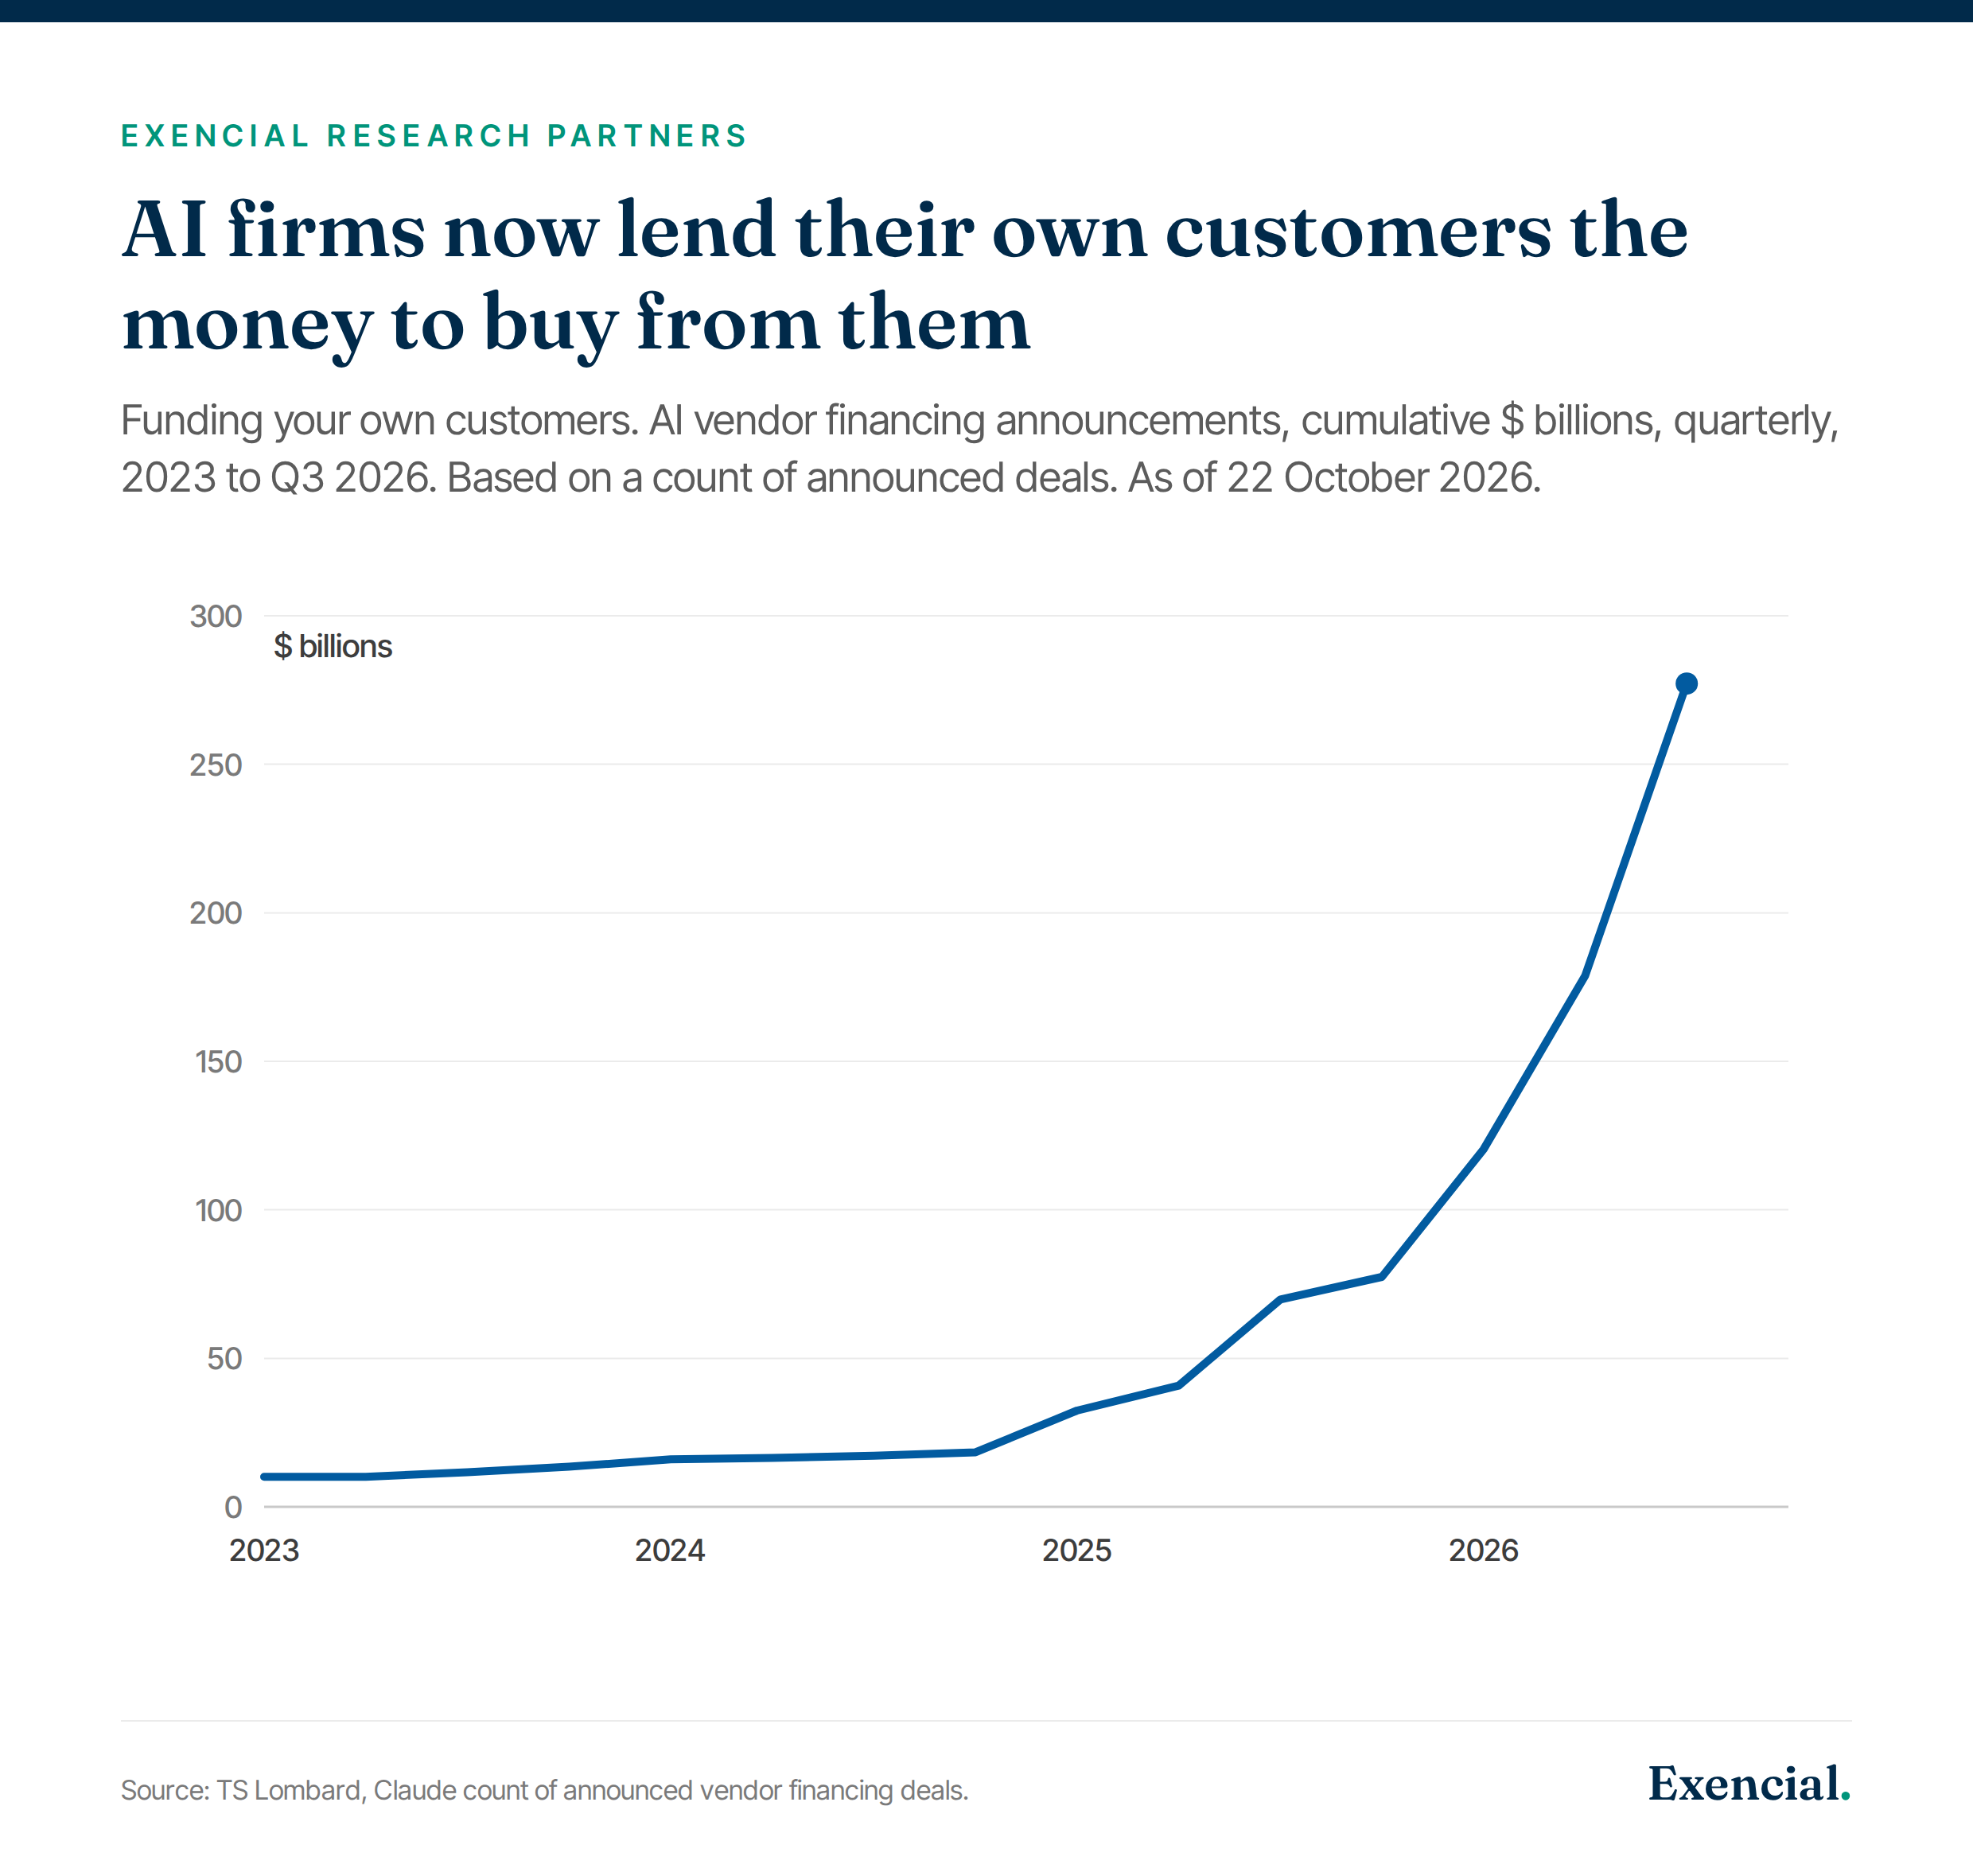
The second sign is vendor financing. This is where a supplier lends its customer the money to buy from it. NVIDIA does it with chip buyers, a practice insiders call “balance sheet as a service”. TS Lombard counted announced AI vendor financing deals and found them rising from about $10 billion in 2023 to nearly $280 billion by the third quarter of 2026. A BIS study cited in the note finds more than 55% of investment into AI firms now comes from other AI firms. Revenue that circles back to the lender is not the same as revenue from a paying customer.
The caveat is that TS Lombard’s recycled revenue series is its own estimate. The chart is sourced to “Claude, TS Lombard”, meaning the split was built with an AI model, not reported by companies. The direction is hard to dispute. The exact 80% figure is an estimate.
What could trigger the reversal?
TS Lombard does not pick one trigger. It lists six and says the crash is “overdetermined”. The phrase means there are so many ways it could end that the exact cause matters less than the vulnerabilities. The note’s own quip is that if something cannot go on forever, it will stop.
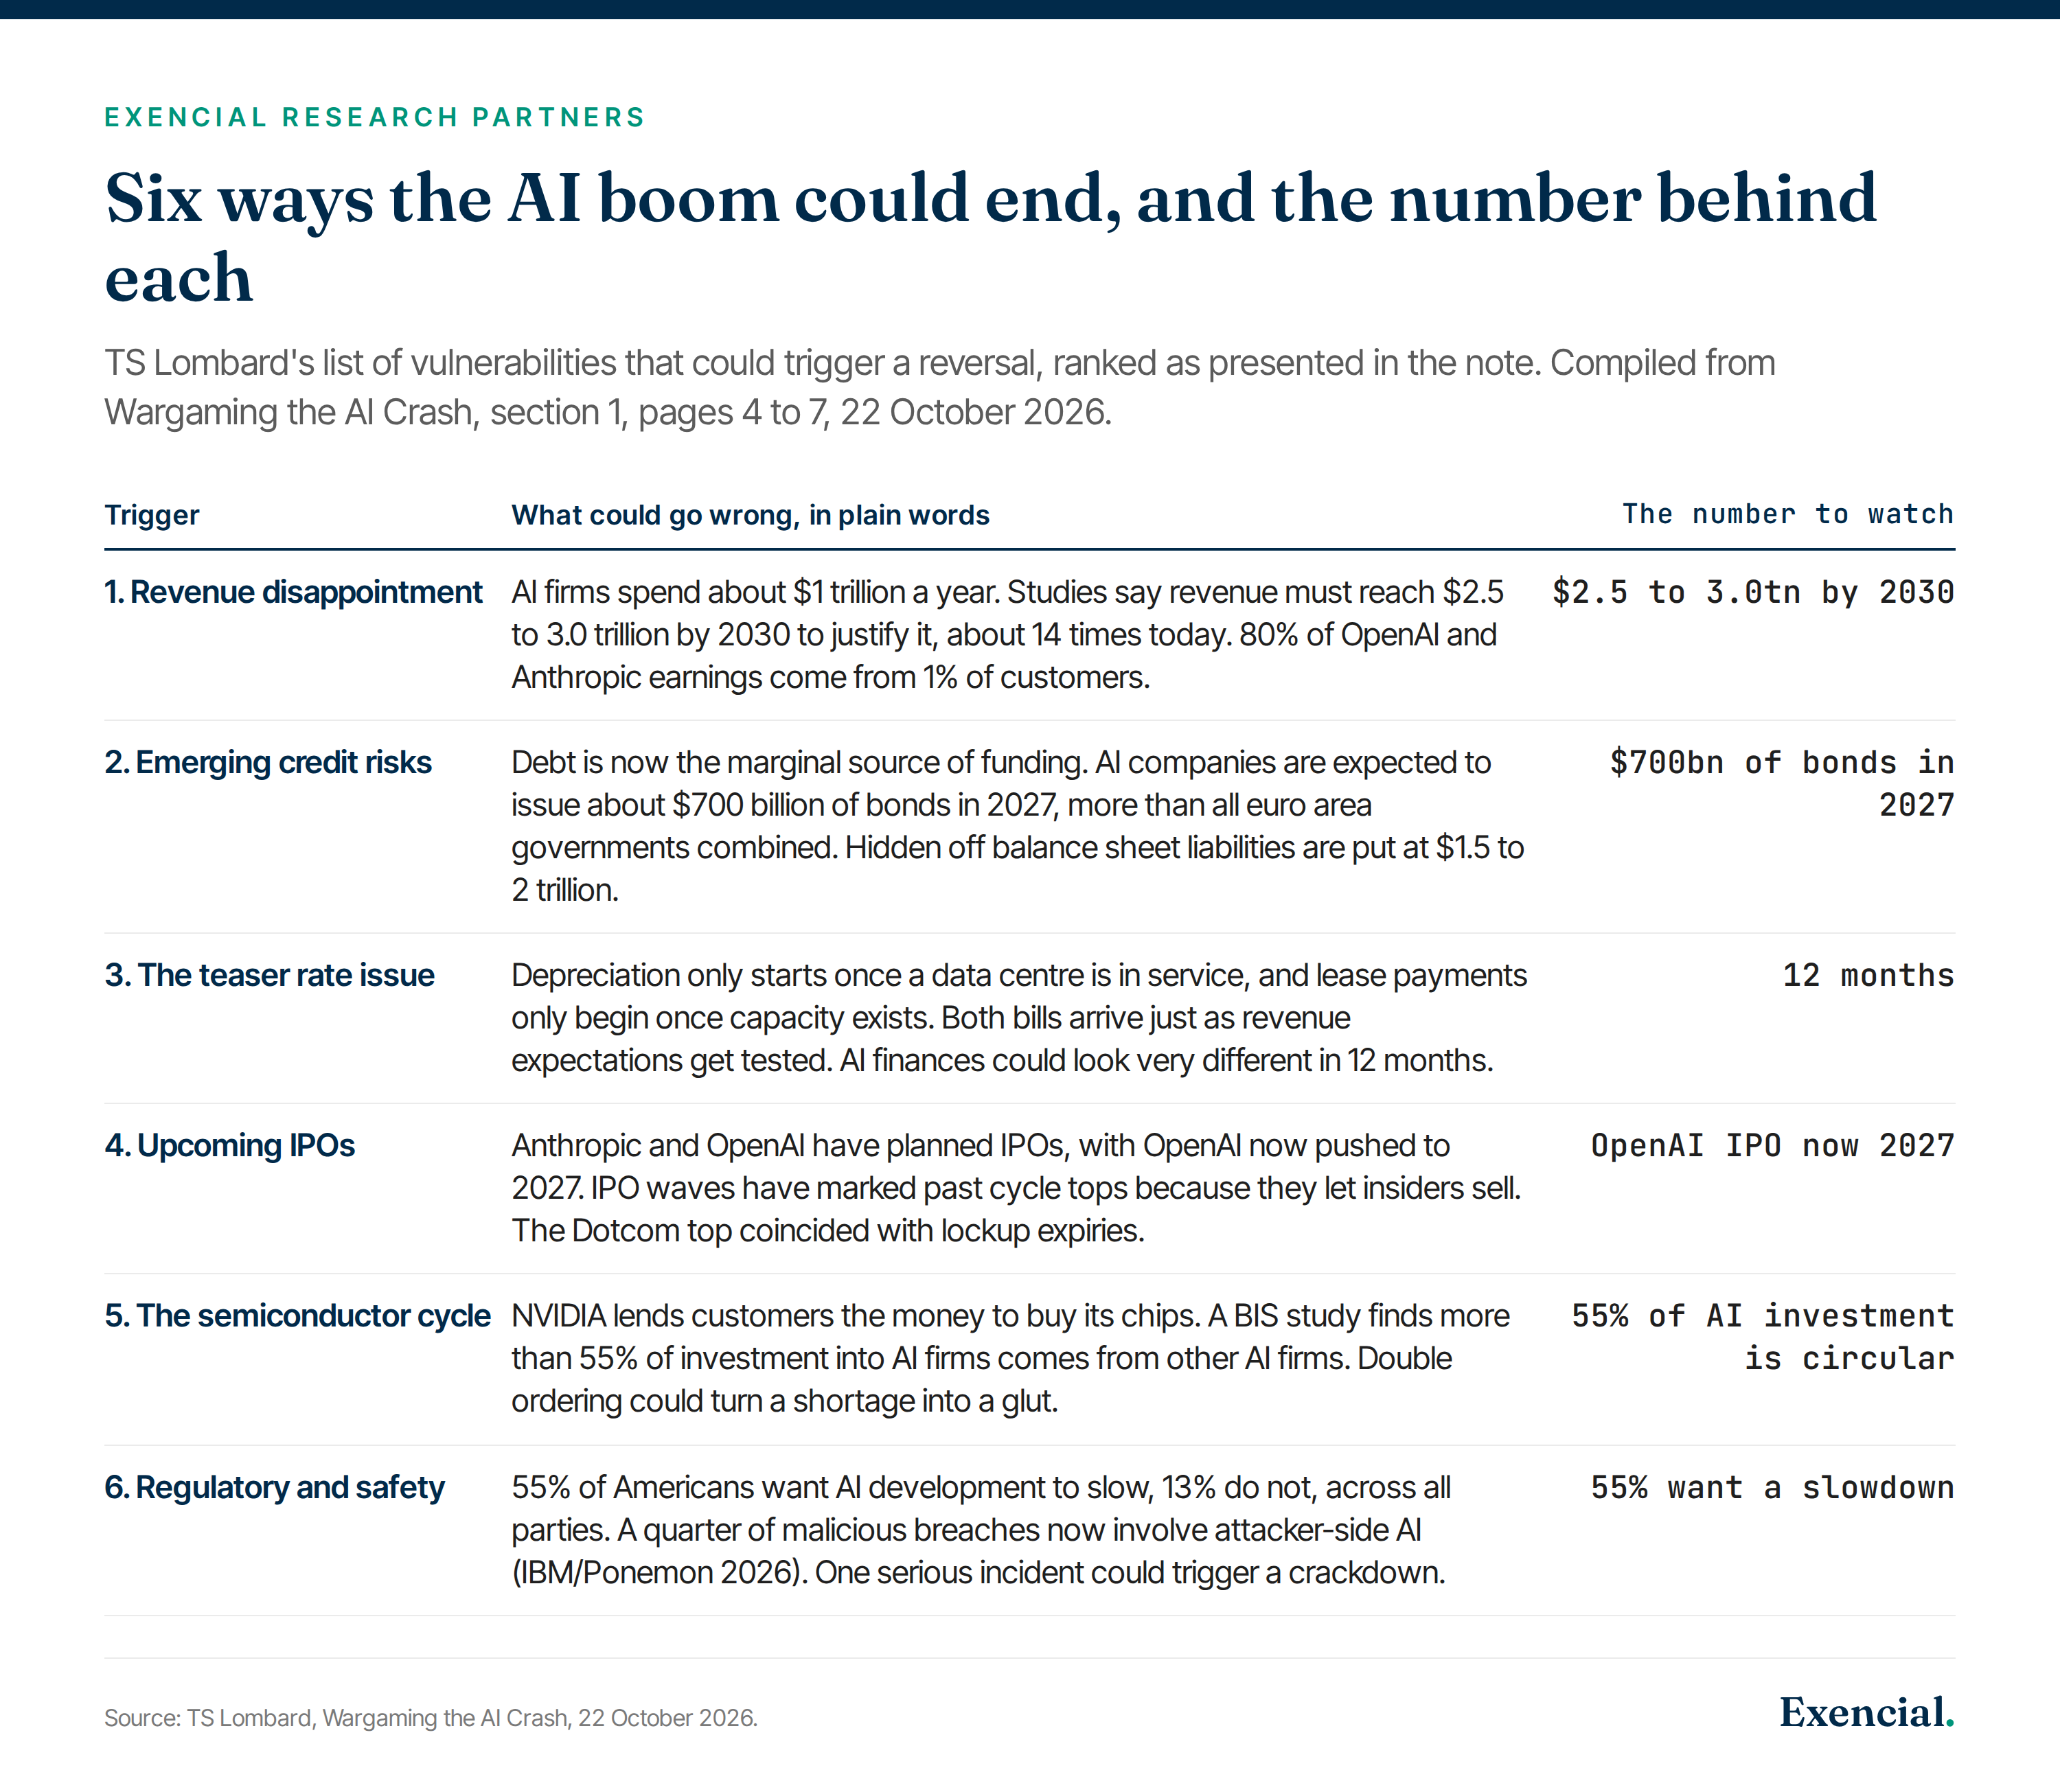
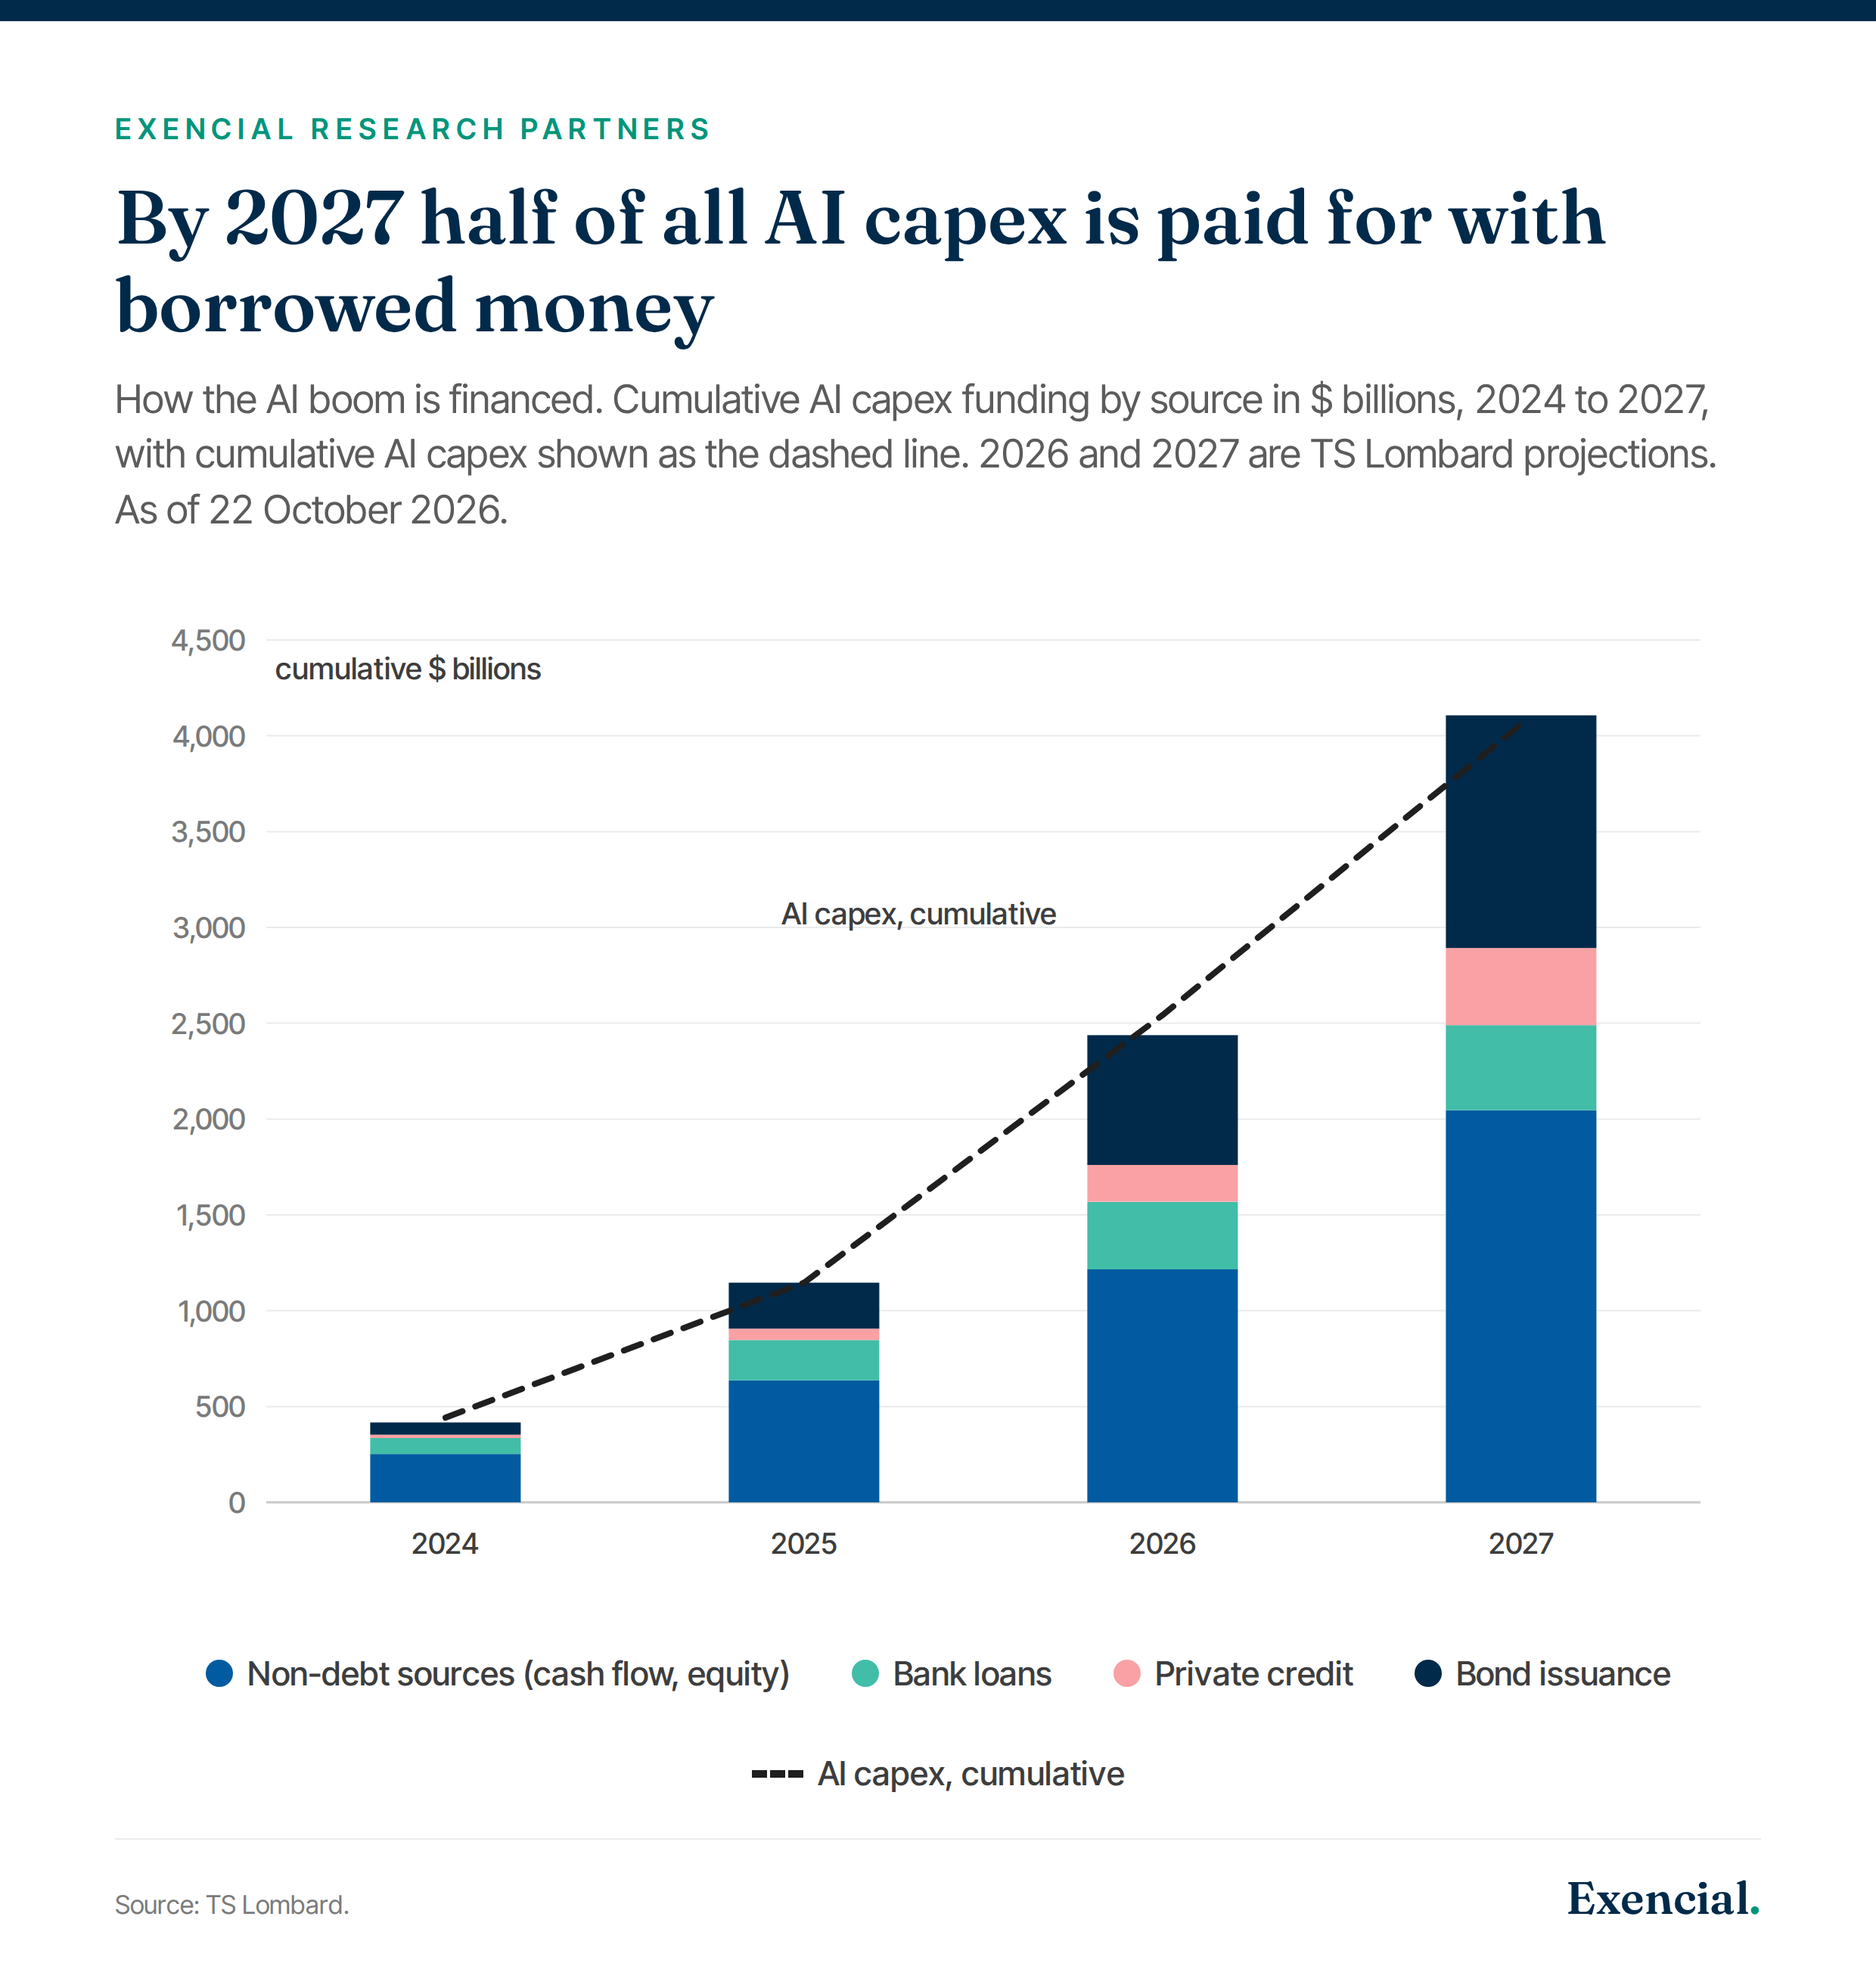
The credit trigger deserves the most attention because it is new. Until recently, hyperscalers paid for AI out of cash flow. TS Lombard’s funding stack shows the shift. In 2024, about 40% of cumulative AI capex was funded with debt. By 2027 it is half, with bond issuance alone at about $1.2 trillion cumulative. The note’s example is Meta’s $30 billion Hyperion data centre in Louisiana. Meta sold 80% of the project to Brown Owl, creating a vehicle called Beignet that raised $27 billion of debt. Meta promised to lease the site back for 20 years, but the lease is split into five four-year chunks. Only a fraction of that liability ever shows on Meta’s balance sheet. Neoclouds like CoreWeave are already paying 15% interest.
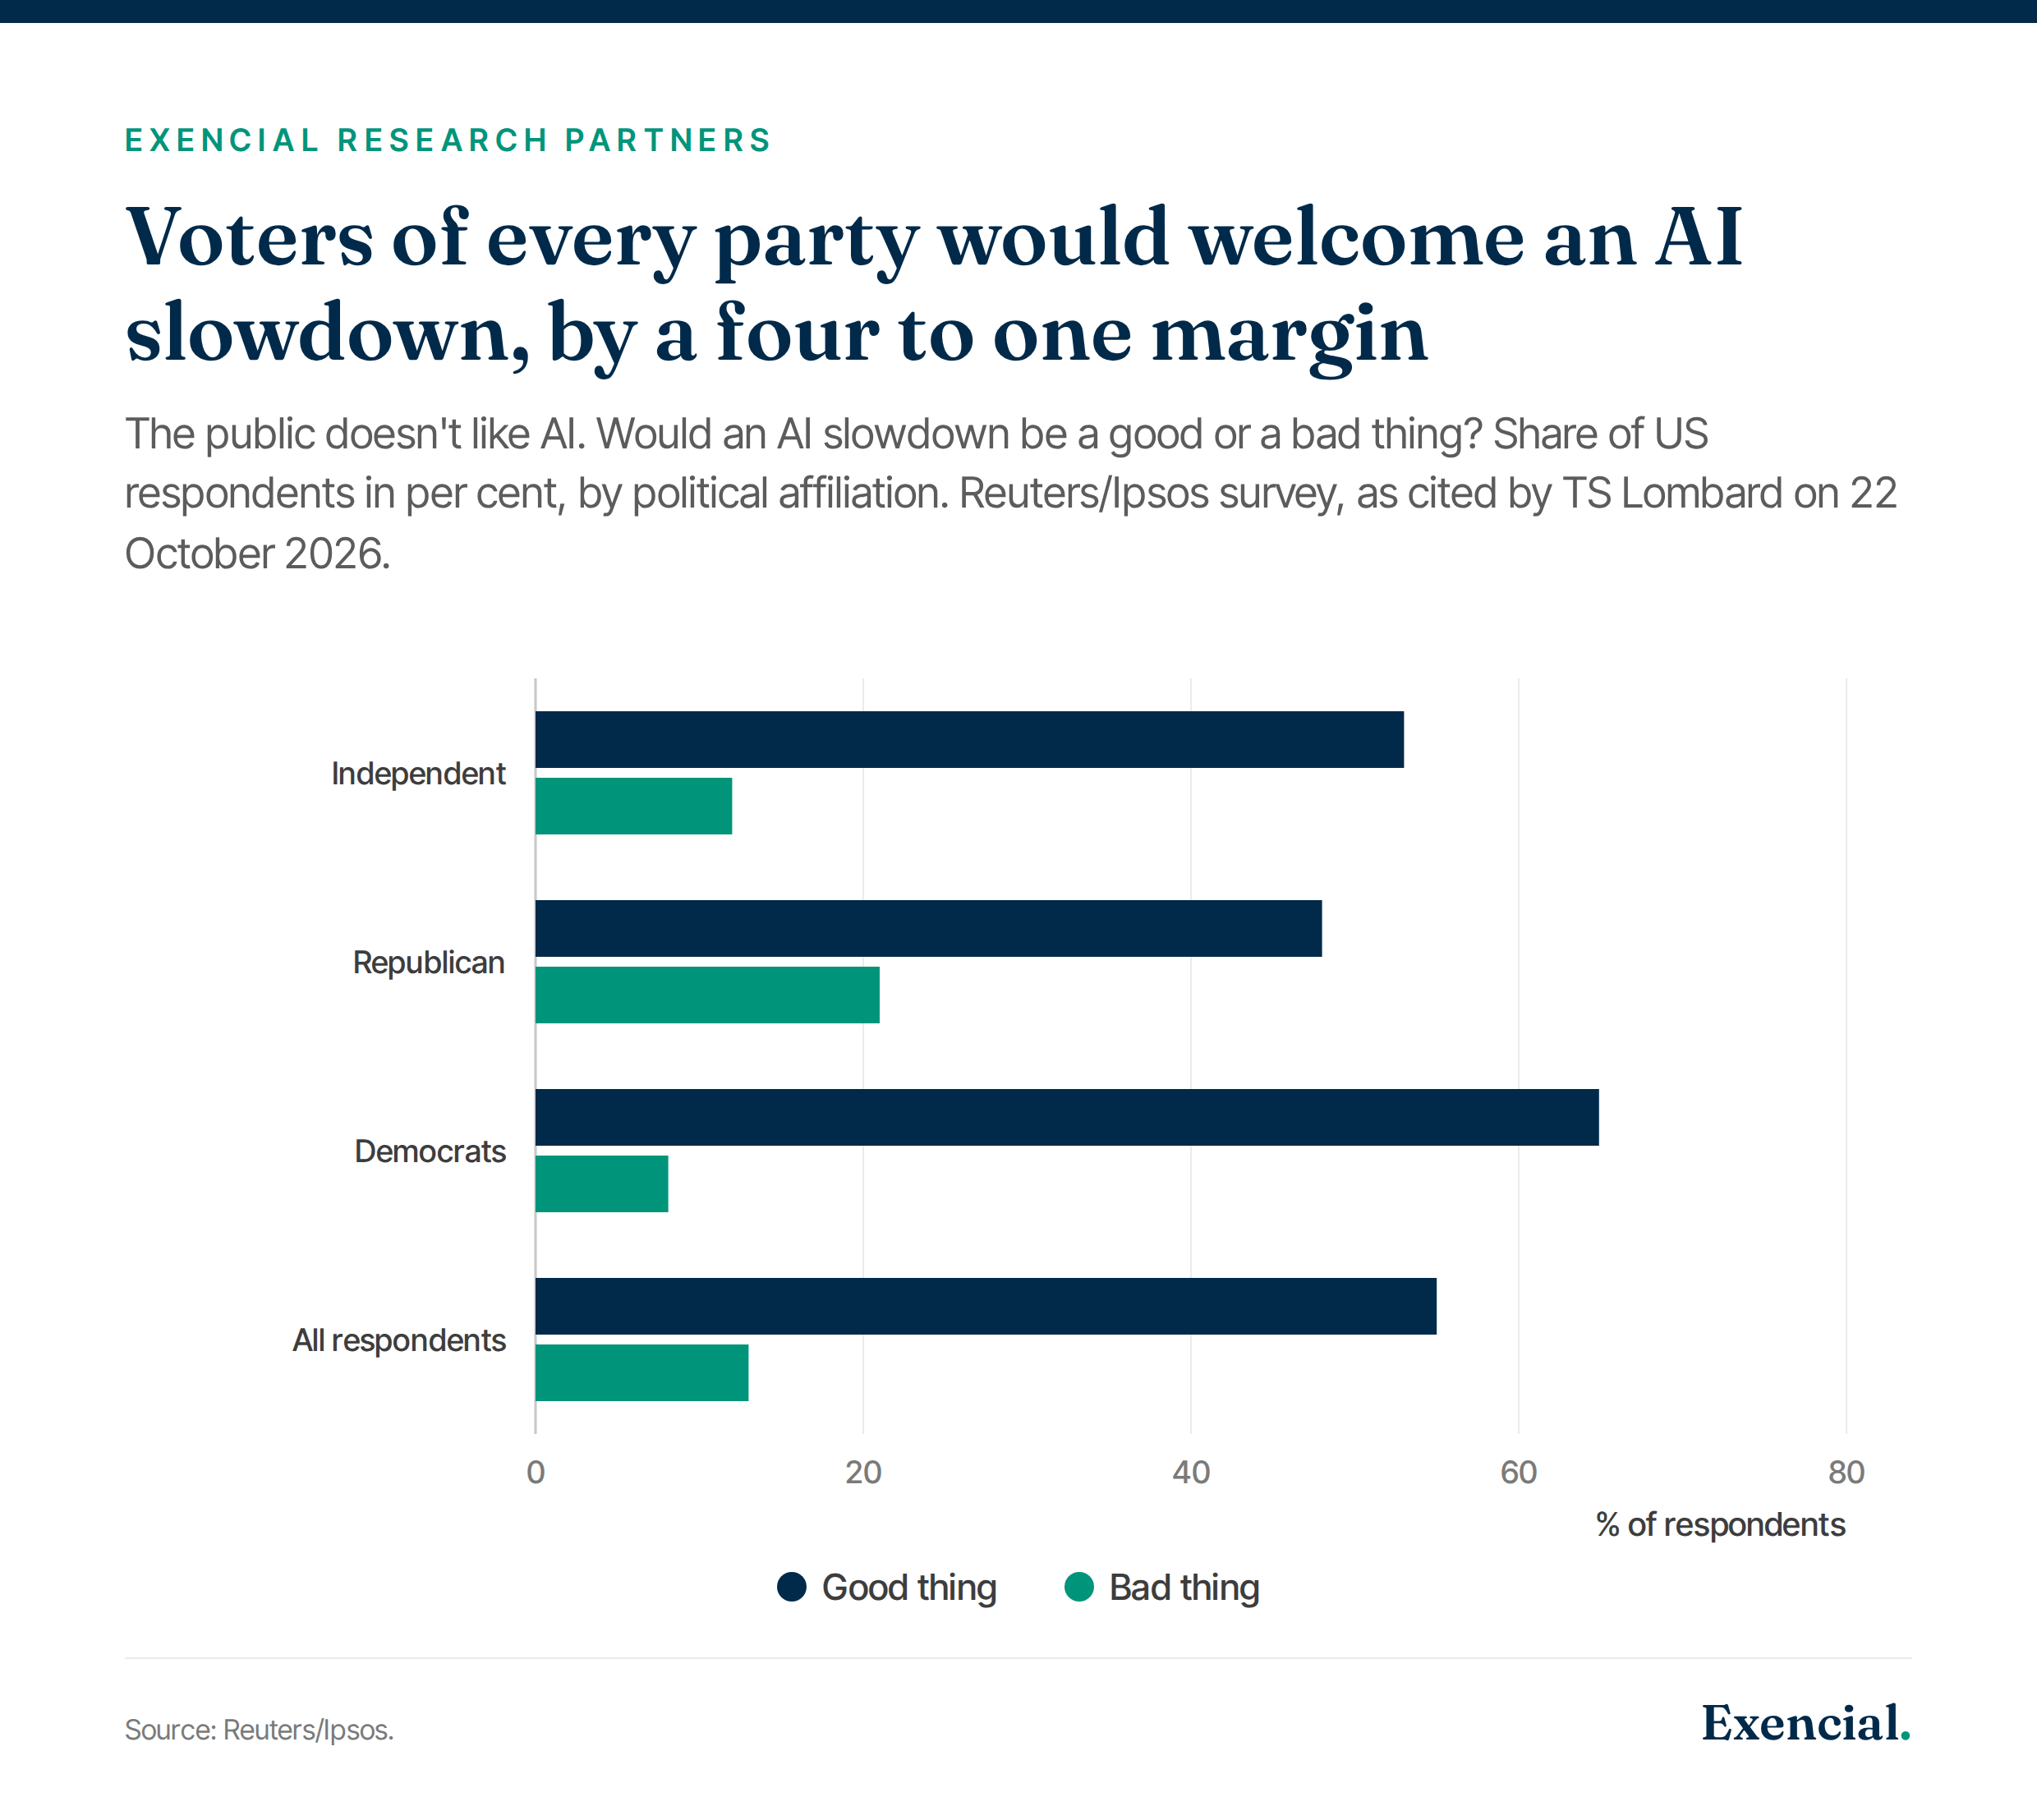
The political trigger is the one investors least expect. A Reuters/Ipsos survey found 55% of Americans think an AI slowdown would be a good thing against 13% who think it would be bad. The split holds for Democrats, Republicans and Independents alike. TS Lombard notes that opposition to AI is one of the few things that unites the country.
The one thing to hold onto is the “second derivative problem”. AI capex does not need to fall to cause stress. It only needs to grow more slowly. The structure resembles subprime. Frontier labs with no profits sign contracts to pay for compute they have not used. Oracle, CoreWeave or a hyperscaler books that promise as backlog and borrows against it. The data centre is the collateral and the lab’s payments are the debt service. It works only while the lab can keep raising money.
How bad does the market damage get?
TS Lombard’s numbers are large for equities and small for credit. The tech share of US market capitalisation recently hit 40%, with semiconductors alone near 20%. The trailing price to earnings ratio on US tech is about 30, down from 40 a year ago and far below the 70 to 75 peak of the Dotcom era. The bull case says the multiple is reasonable because earnings are real. TS Lombard’s reply is that the “E” is the problem, not the “P”. If revenue is recycled capex, earnings fall when capex falls. On top of that, hyperscalers book valuation gains on their cross holdings of other AI companies in an “other” revenue line, and that would reverse too.
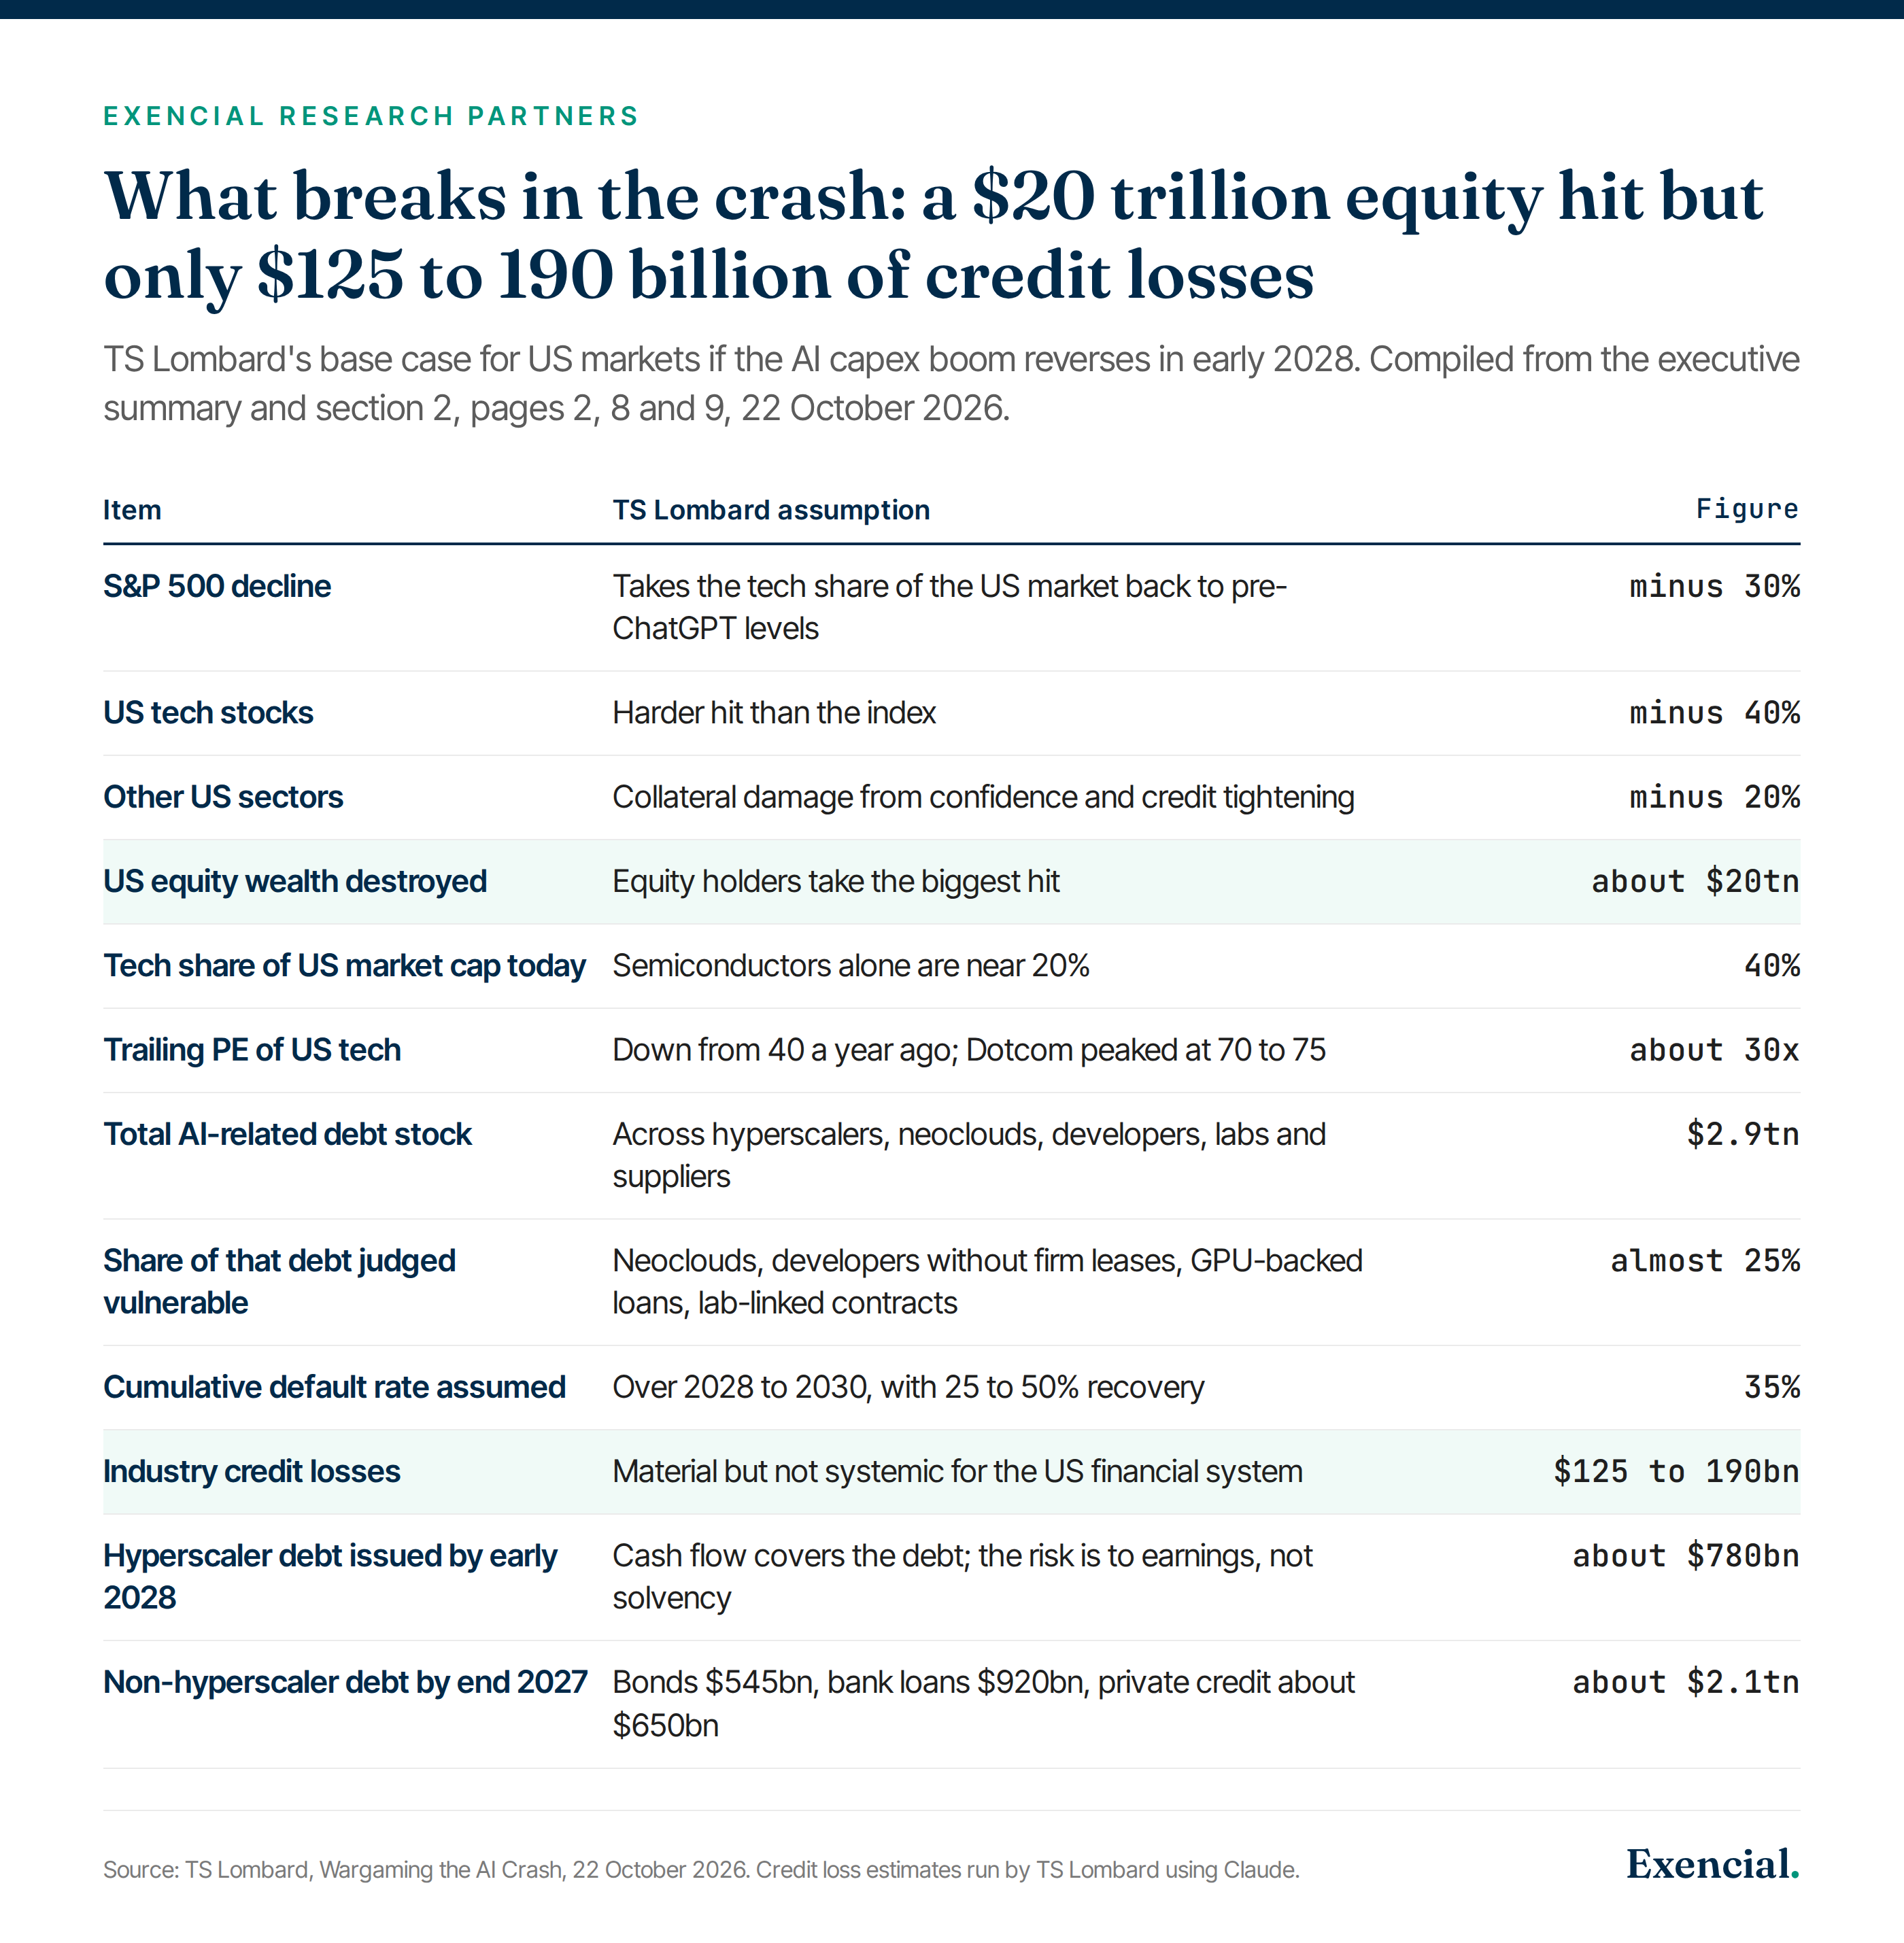
The credit maths runs like this. TS Lombard puts the total stock of AI-related debt at $2.9 trillion by the end of 2027. It judges almost 25% of it vulnerable: neoclouds, developers without firm hyperscaler leases, loans backed by GPUs, and contracts linked to the labs. It then applies a 35% cumulative default rate over 2028 to 2030 and a recovery of 25 to 50%. The answer is $125 to 190 billion of losses. For comparison, the equity hit is $20 trillion, more than 100 times bigger. The pain sits upstream of the hyperscalers: neoclouds such as CoreWeave, Oracle, single-asset project vehicles, OpenAI, Anthropic and the AI app startups.
The caveat is that the credit loss estimate was itself run on Claude. TS Lombard says so in the text. The inputs are assumptions about which debt is vulnerable and how much defaults. A 50% default rate instead of 35% would push losses toward $250 billion. The conclusion that this is not systemic would still hold. The number would not.
Why is the recession mild if $20 trillion of wealth vanishes?
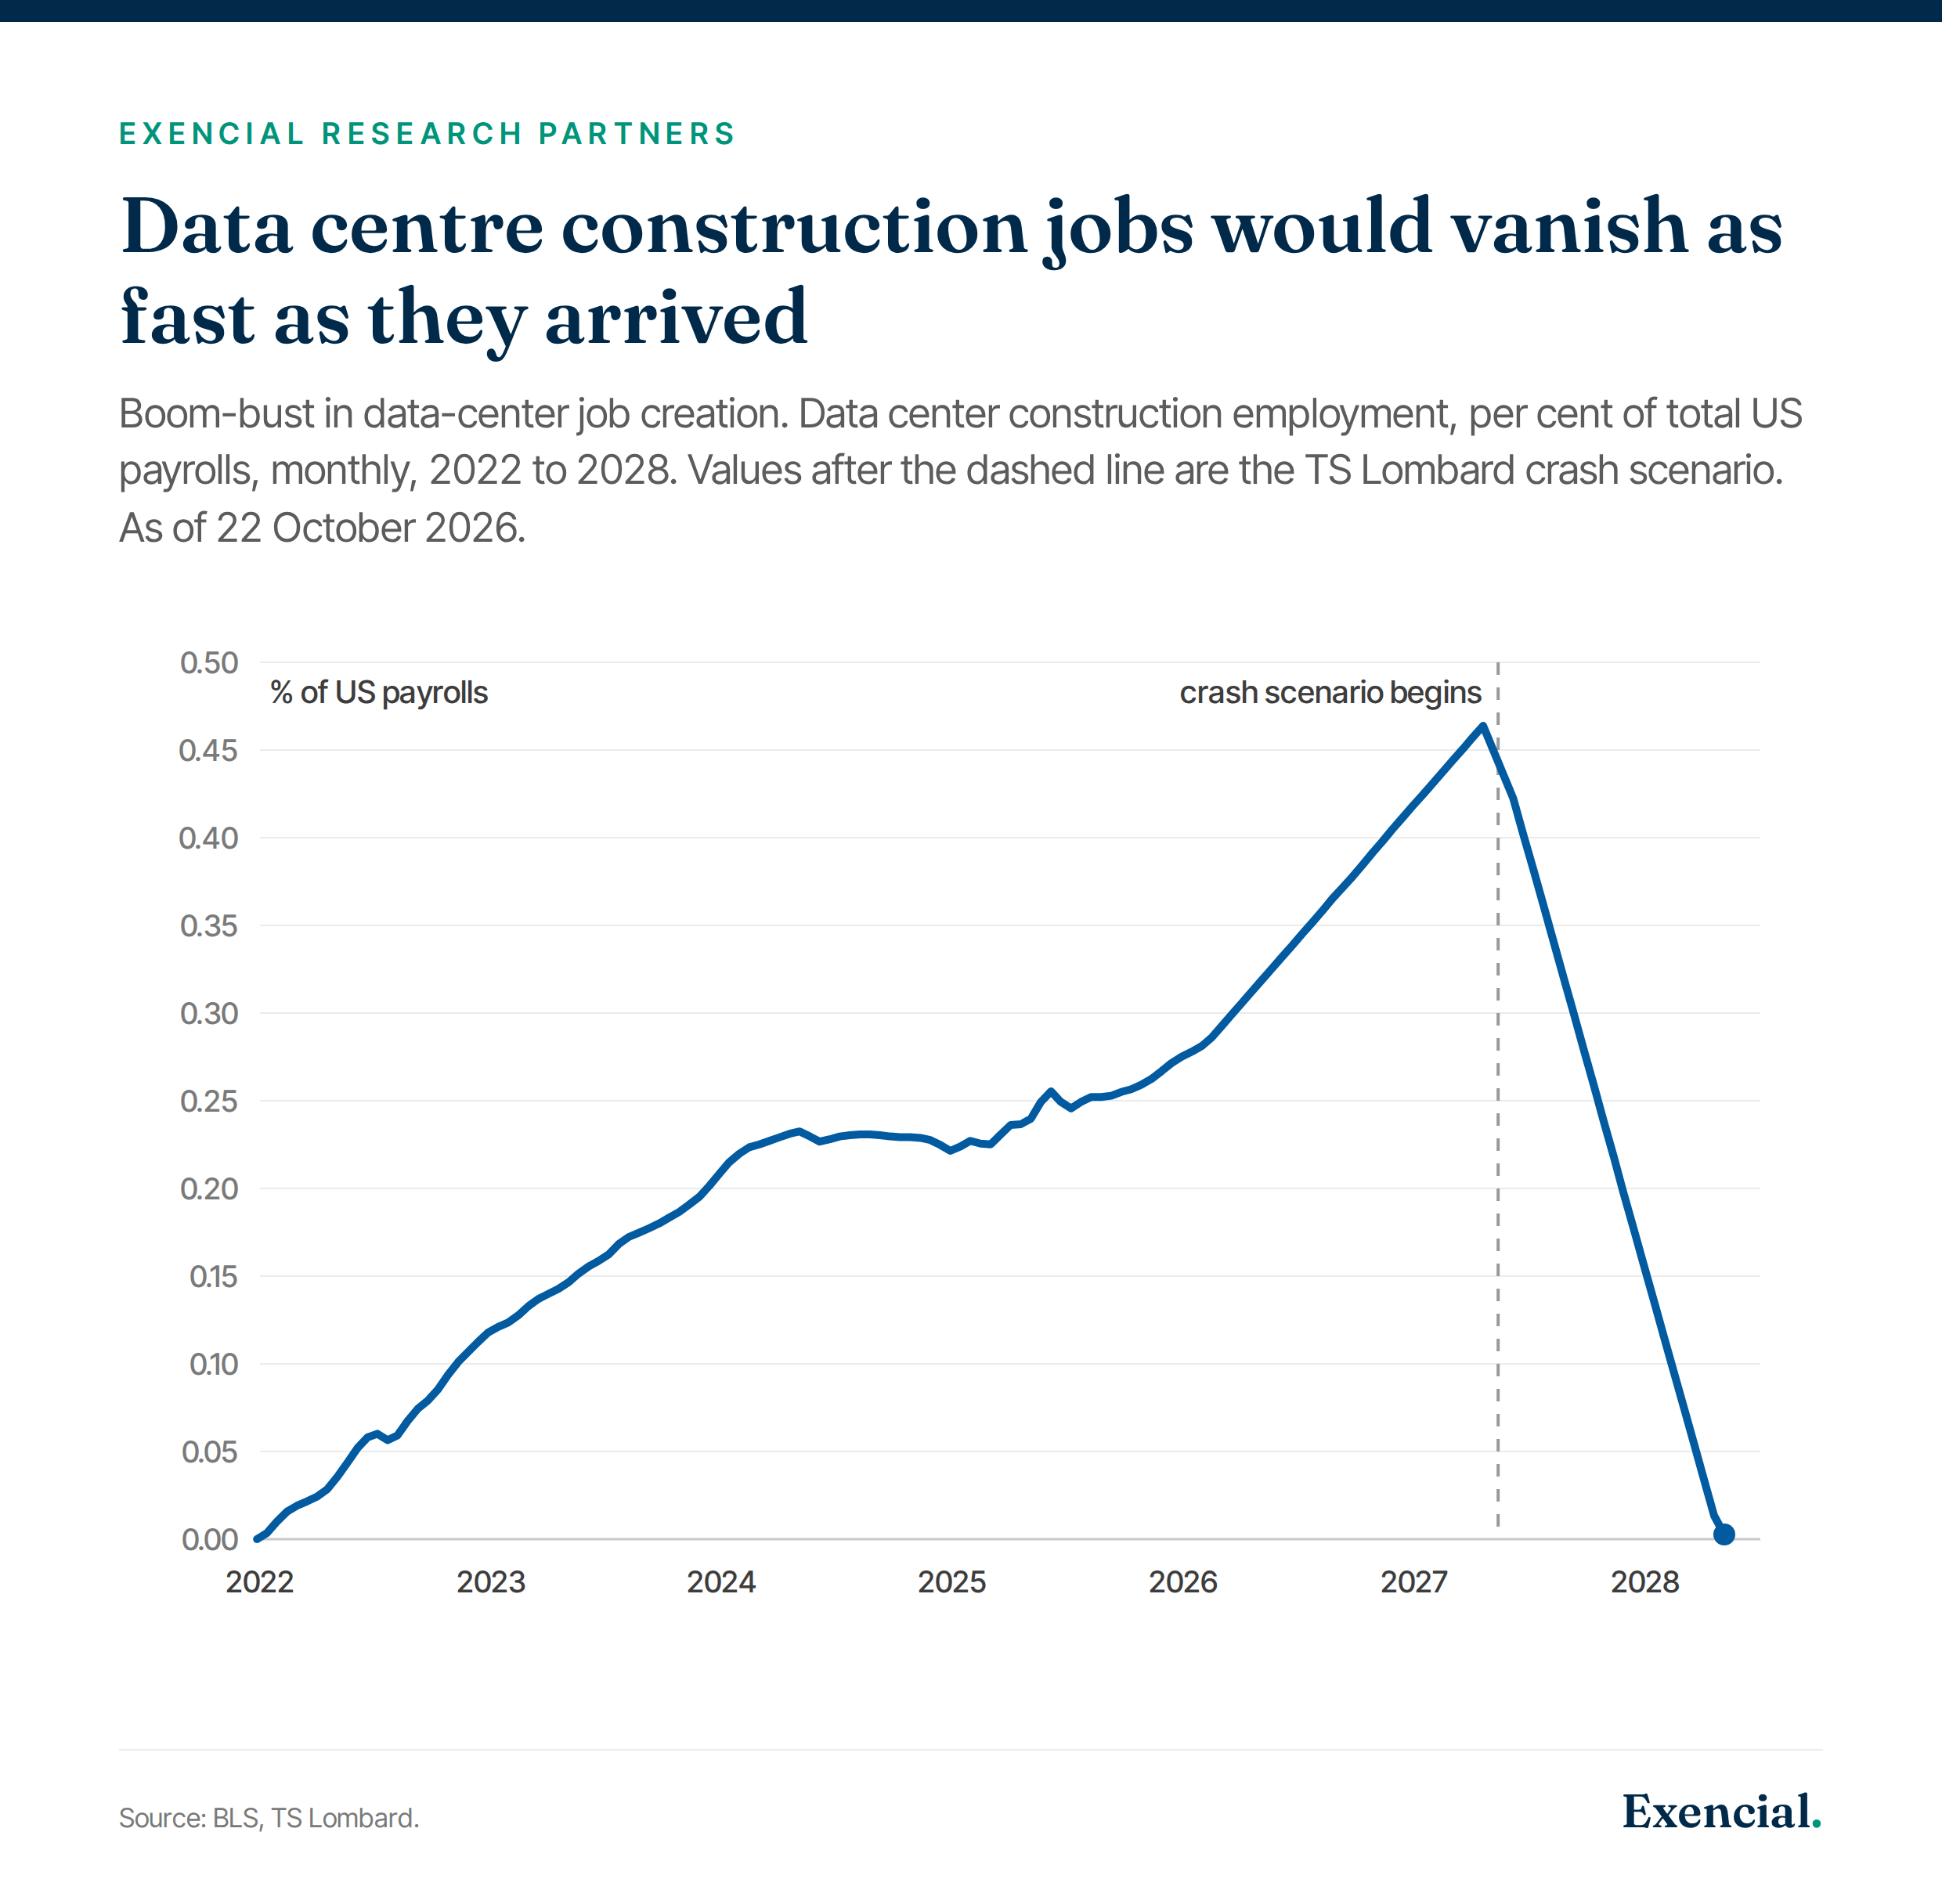
This is the contradiction at the centre of the note, and TS Lombard resolves it in four steps. On one side, the AI boom is one of the largest investment projects in history. US tech capex rises from about 2.2% of GDP in 2023 to nearly 5% by late 2027 in TS Lombard’s path, then halves within a year in the crash. Data centre construction employs about 500,000 people today and could reach 800,000 by the end of 2027. Then those jobs go. On the other side, the note calls the recession mild and compares it to 1990 or 2001. How can both be true?
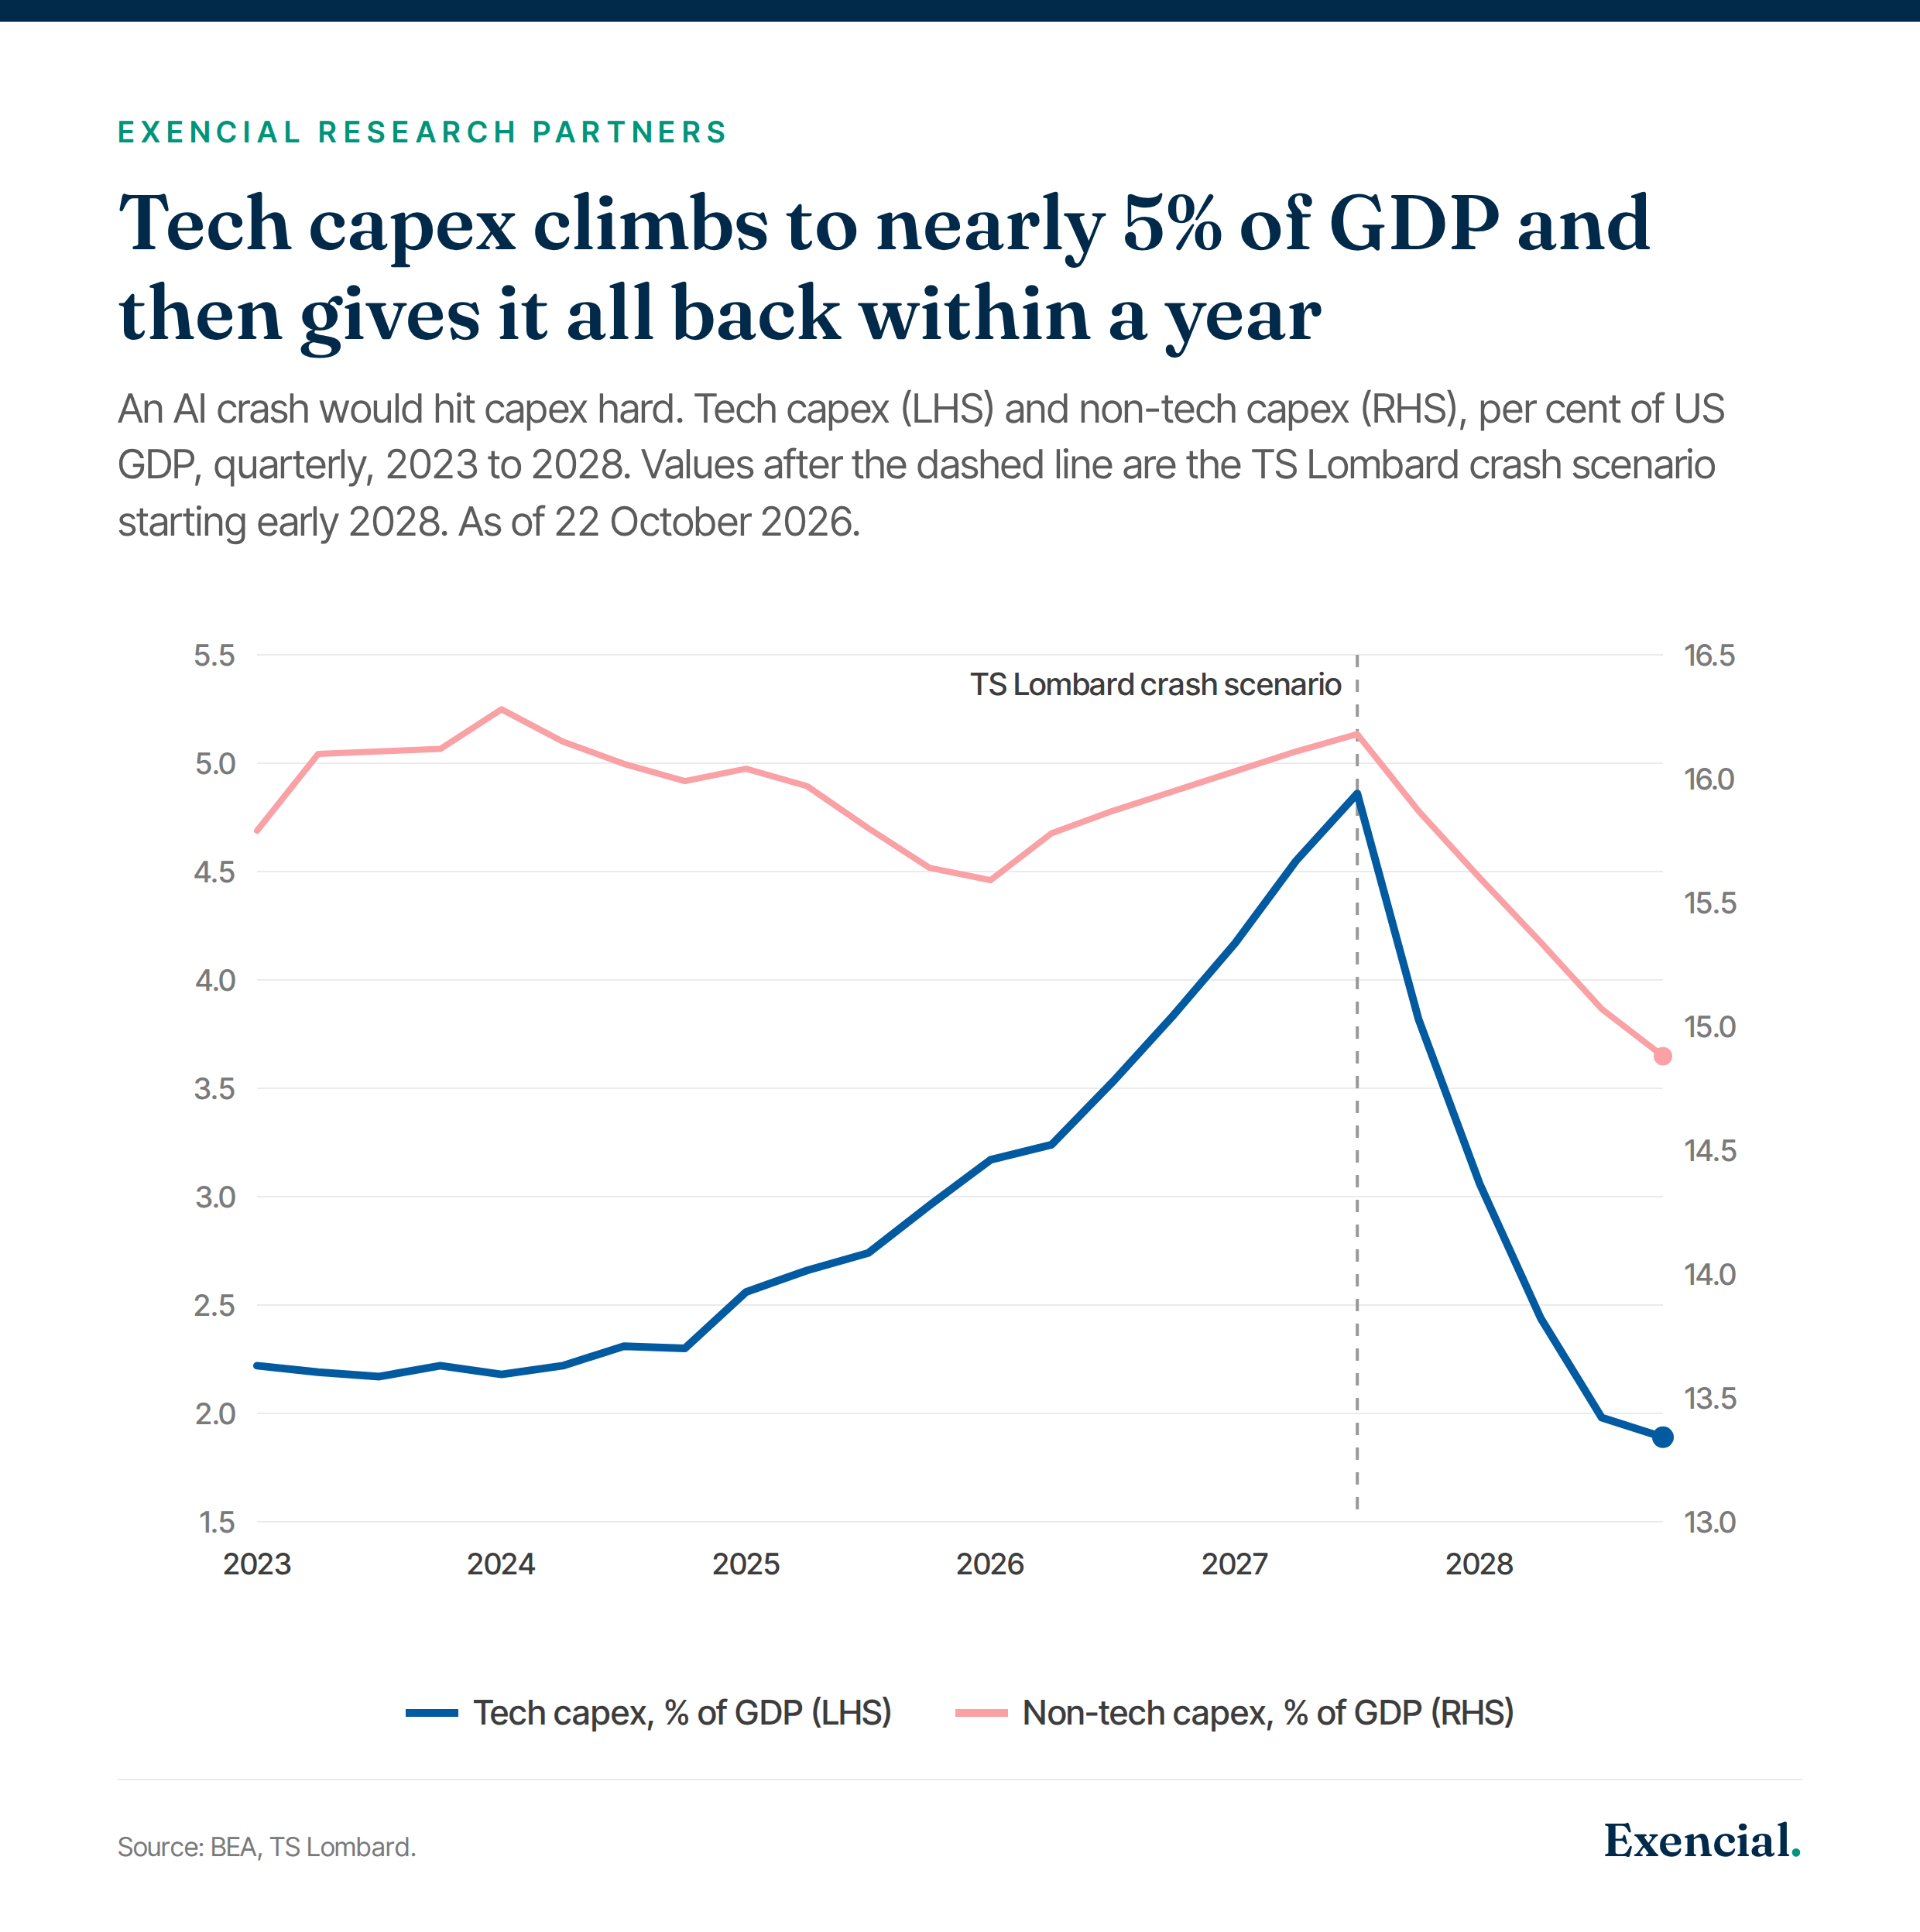
First, imports absorb most of the capex hit. Tech capex will have added almost 3 percentage points of GDP by early 2028. A full reversal sounds like a 3 point hole. But data centre investment is extremely import-heavy. When capex stops, the import bill stops with it, and in GDP accounting that offsets most of the decline. After adding domestic value added on those imports and some spillover to non-tech capex, TS Lombard lands on a hit of about 2 percentage points to the level of GDP. The IMF published a similar figure in its latest World Economic Outlook.
Second, the job losses are small against the whole labour market. Even 800,000 construction jobs disappearing adds only about 50 basis points to the unemployment rate, before any hit to confidence. The AI boom has been capital-heavy and labour-light.
Third, the wealth effect is weaker than people think. The fear is that a stock crash makes the rich stop spending. TS Lombard’s answer is that the US savings rate stopped responding to wealth around 2016. Wealth effects are stronger from housing than from equities, and most gains since 2016 came from equities held by people who already spend a small share of their income. The note still expects a confidence hit. It does not expect consumption to collapse.
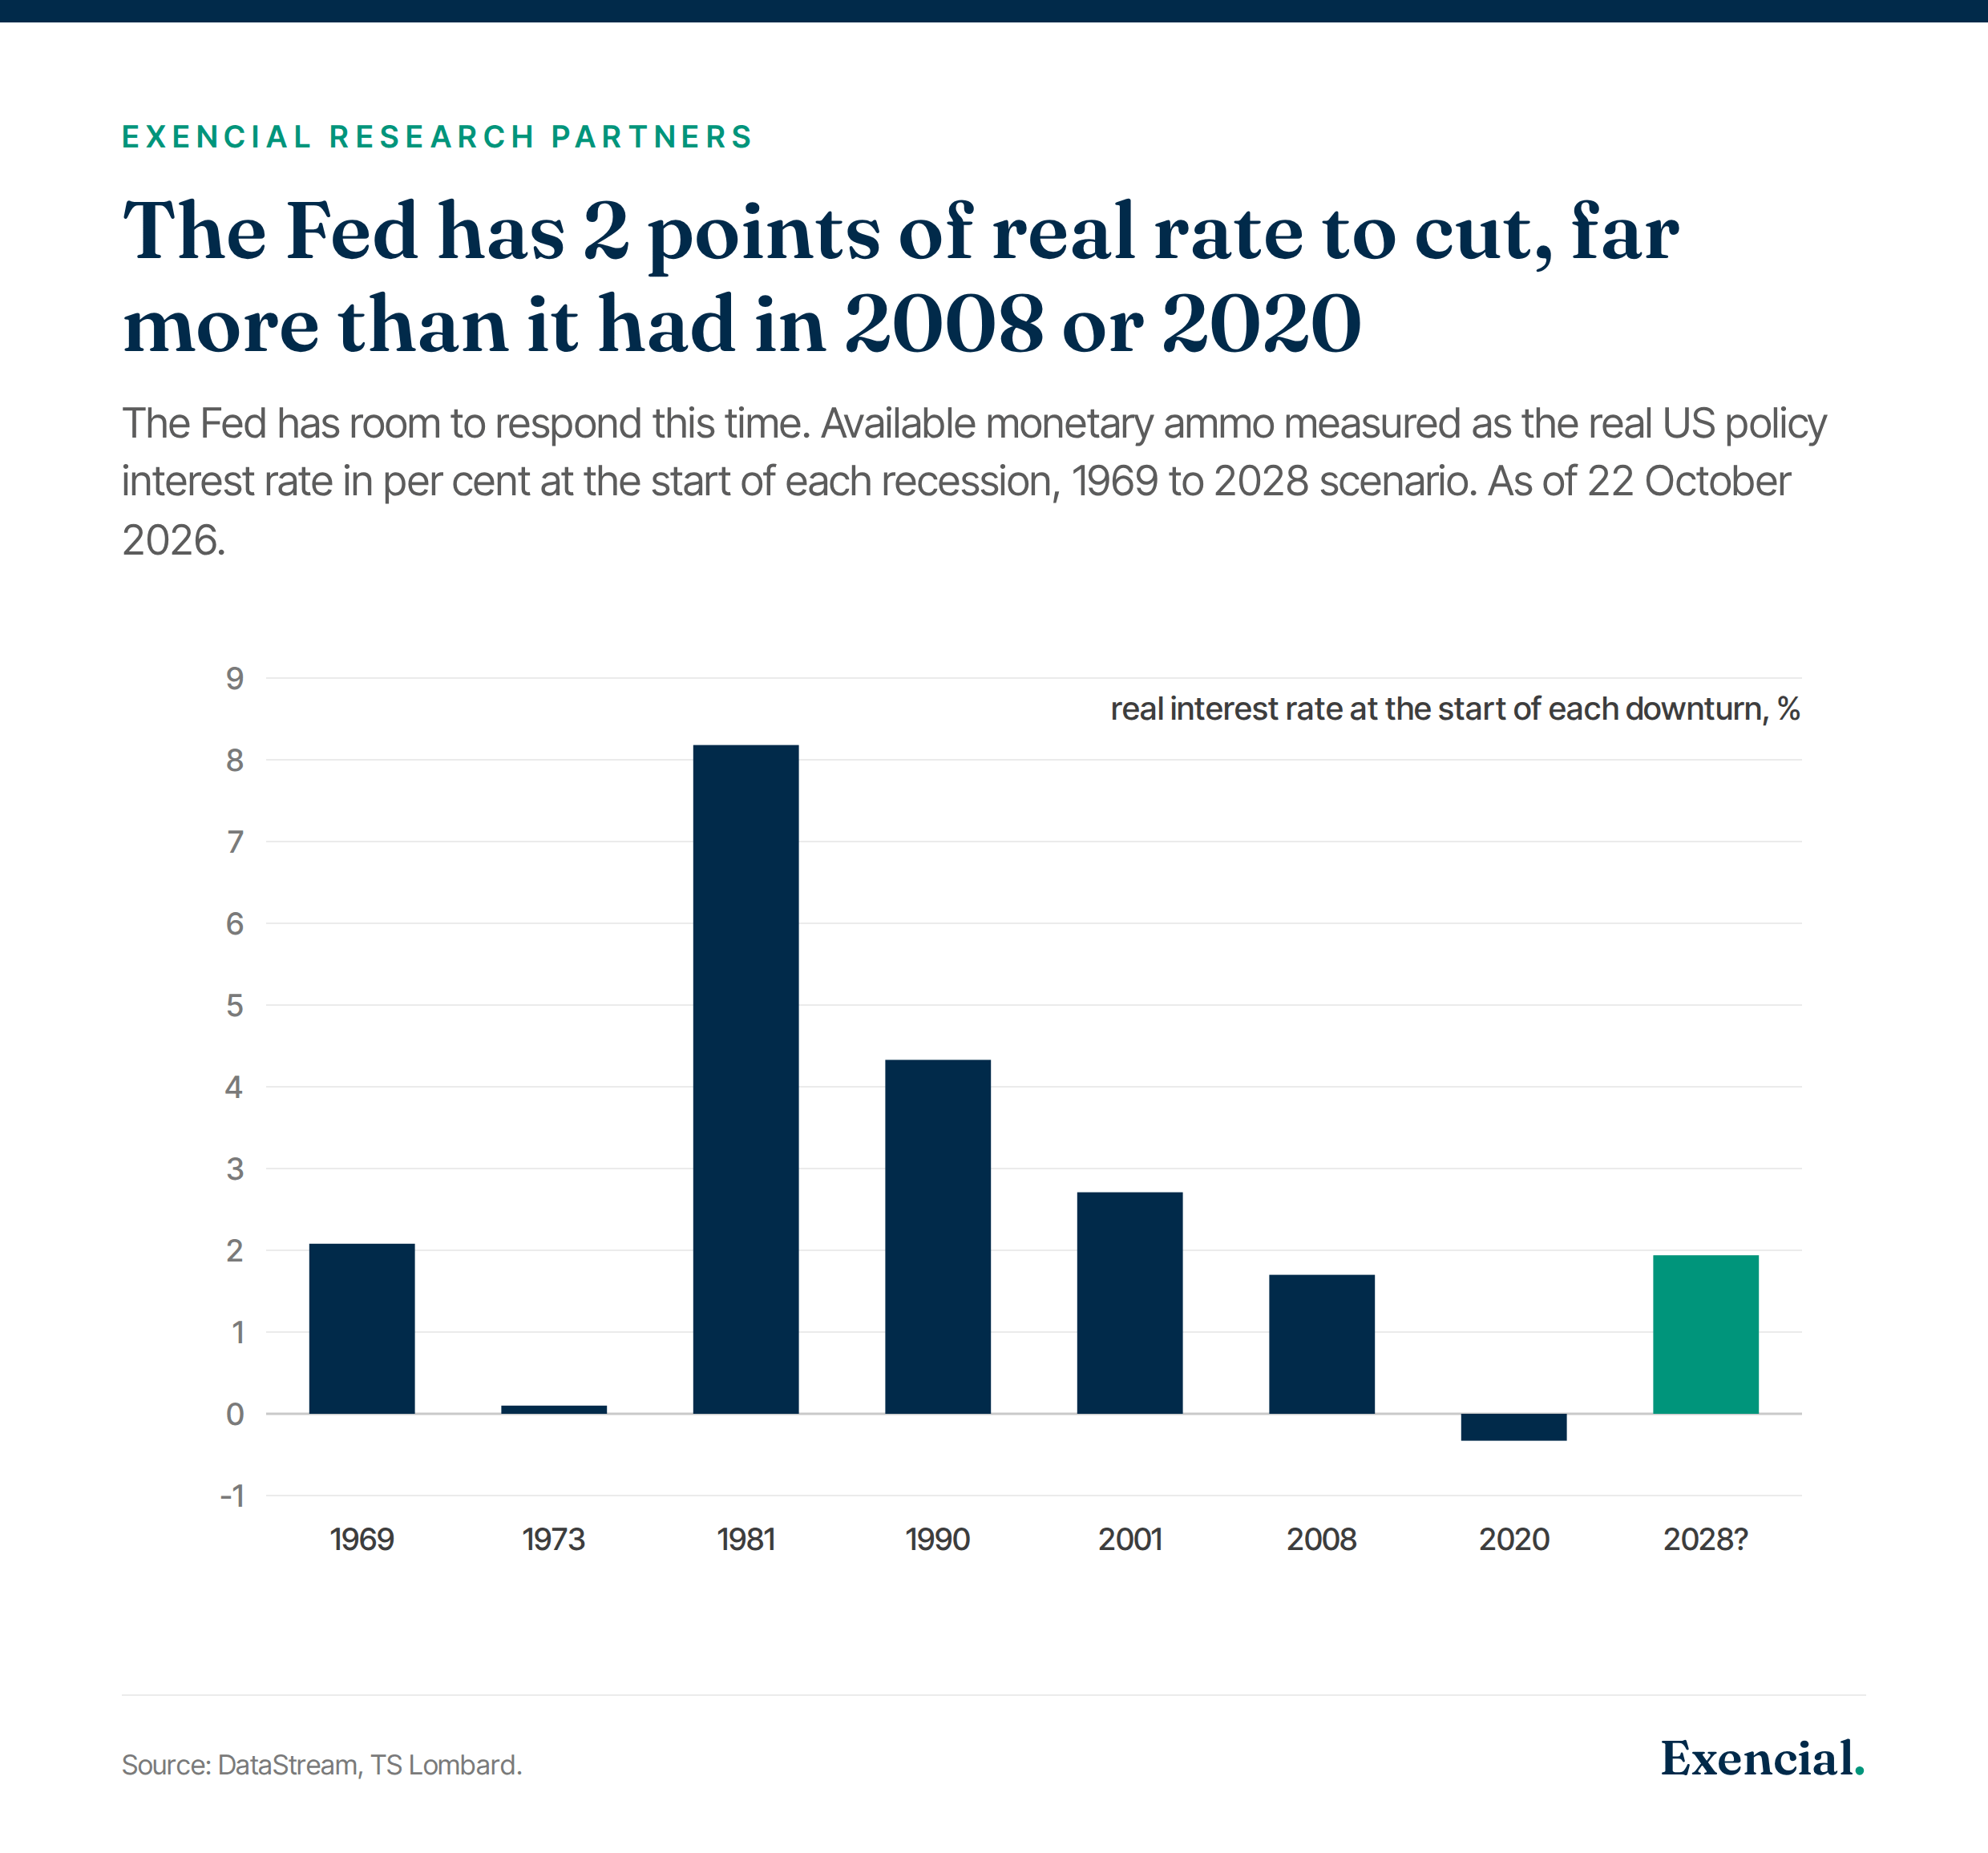
Fourth, the Fed has ammunition. Measured as the real policy rate at the start of a downturn, the Fed enters 2028 with about 2 points to cut. That is more than in 2008 (1.7) or 2020 (below zero), though far less than the 8 points available in 1981. The key claim is where the cuts land. The AI boom crowded out rate-sensitive parts of the economy: low-end consumers, consumer durables, housing. Those are the bottom of America’s “K-shaped” economy, where the rich and poor have diverged. Rate cuts hit them first.
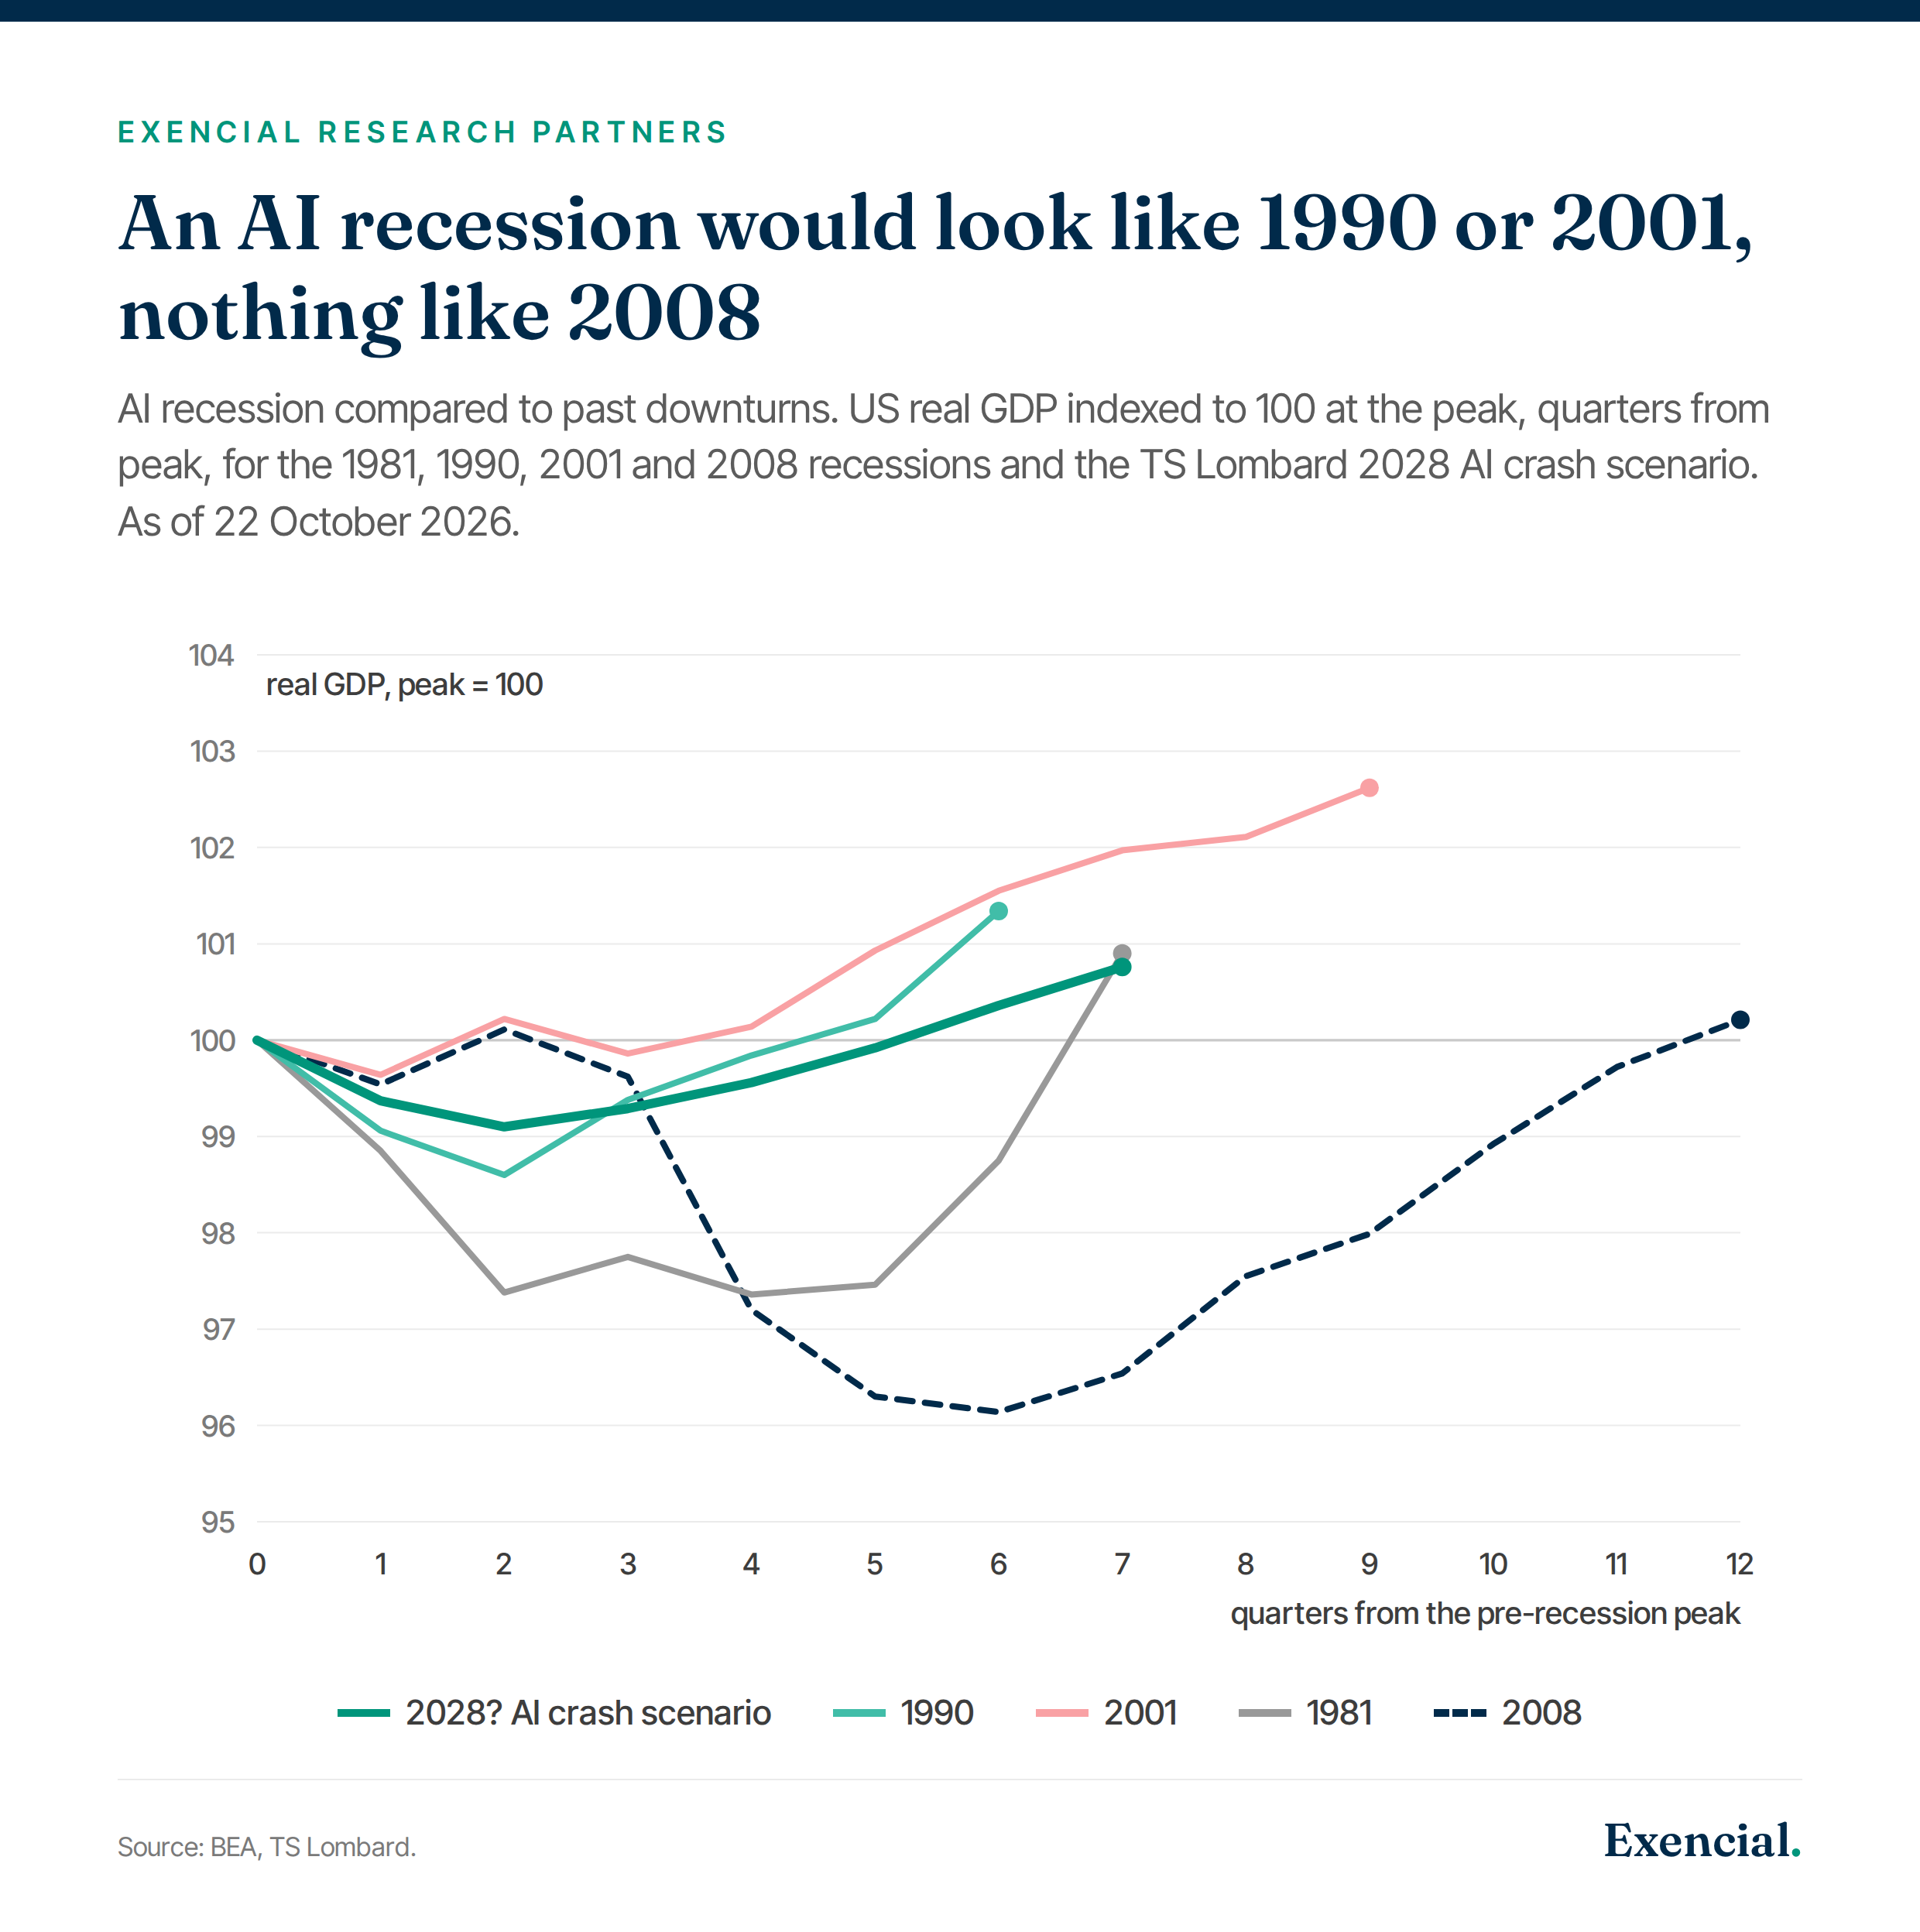
The historical anchor is US private debt. Corporate and household debt is about 165% of GDP, well below the 200% peak before 2008. Private debt is set to rise by less than 10 points of GDP through the boom. TS Lombard says the closer analogy is the late 1980s, which ended in a mild recession and the savings and loan crisis, not a systemic collapse. The note also rejects Julien Garran’s claim that this is the “biggest misallocation of capital in history”. His “Wicksellian deficit” metric, it says, compounds errors in estimates of the neutral rate.
What should investors buy, and when?
Global stocks now, government bonds later, and expect a weaker dollar. TS Lombard is candid that timing is the whole problem. Shorting US tech or buying long bonds too early guarantees underperformance while the boom runs. Its answer borrows from Ben Inker at GMO. Dotcom was an “easy” bubble because a 60:40 portfolio with small caps, REITs and emerging markets avoided the worst of it. Subprime was “hard” because it took the whole financial system down. TS Lombard says AI is an easy bubble. A diversified portfolio of international equities holds a normal amount of risk and skips the bubbliest assets.
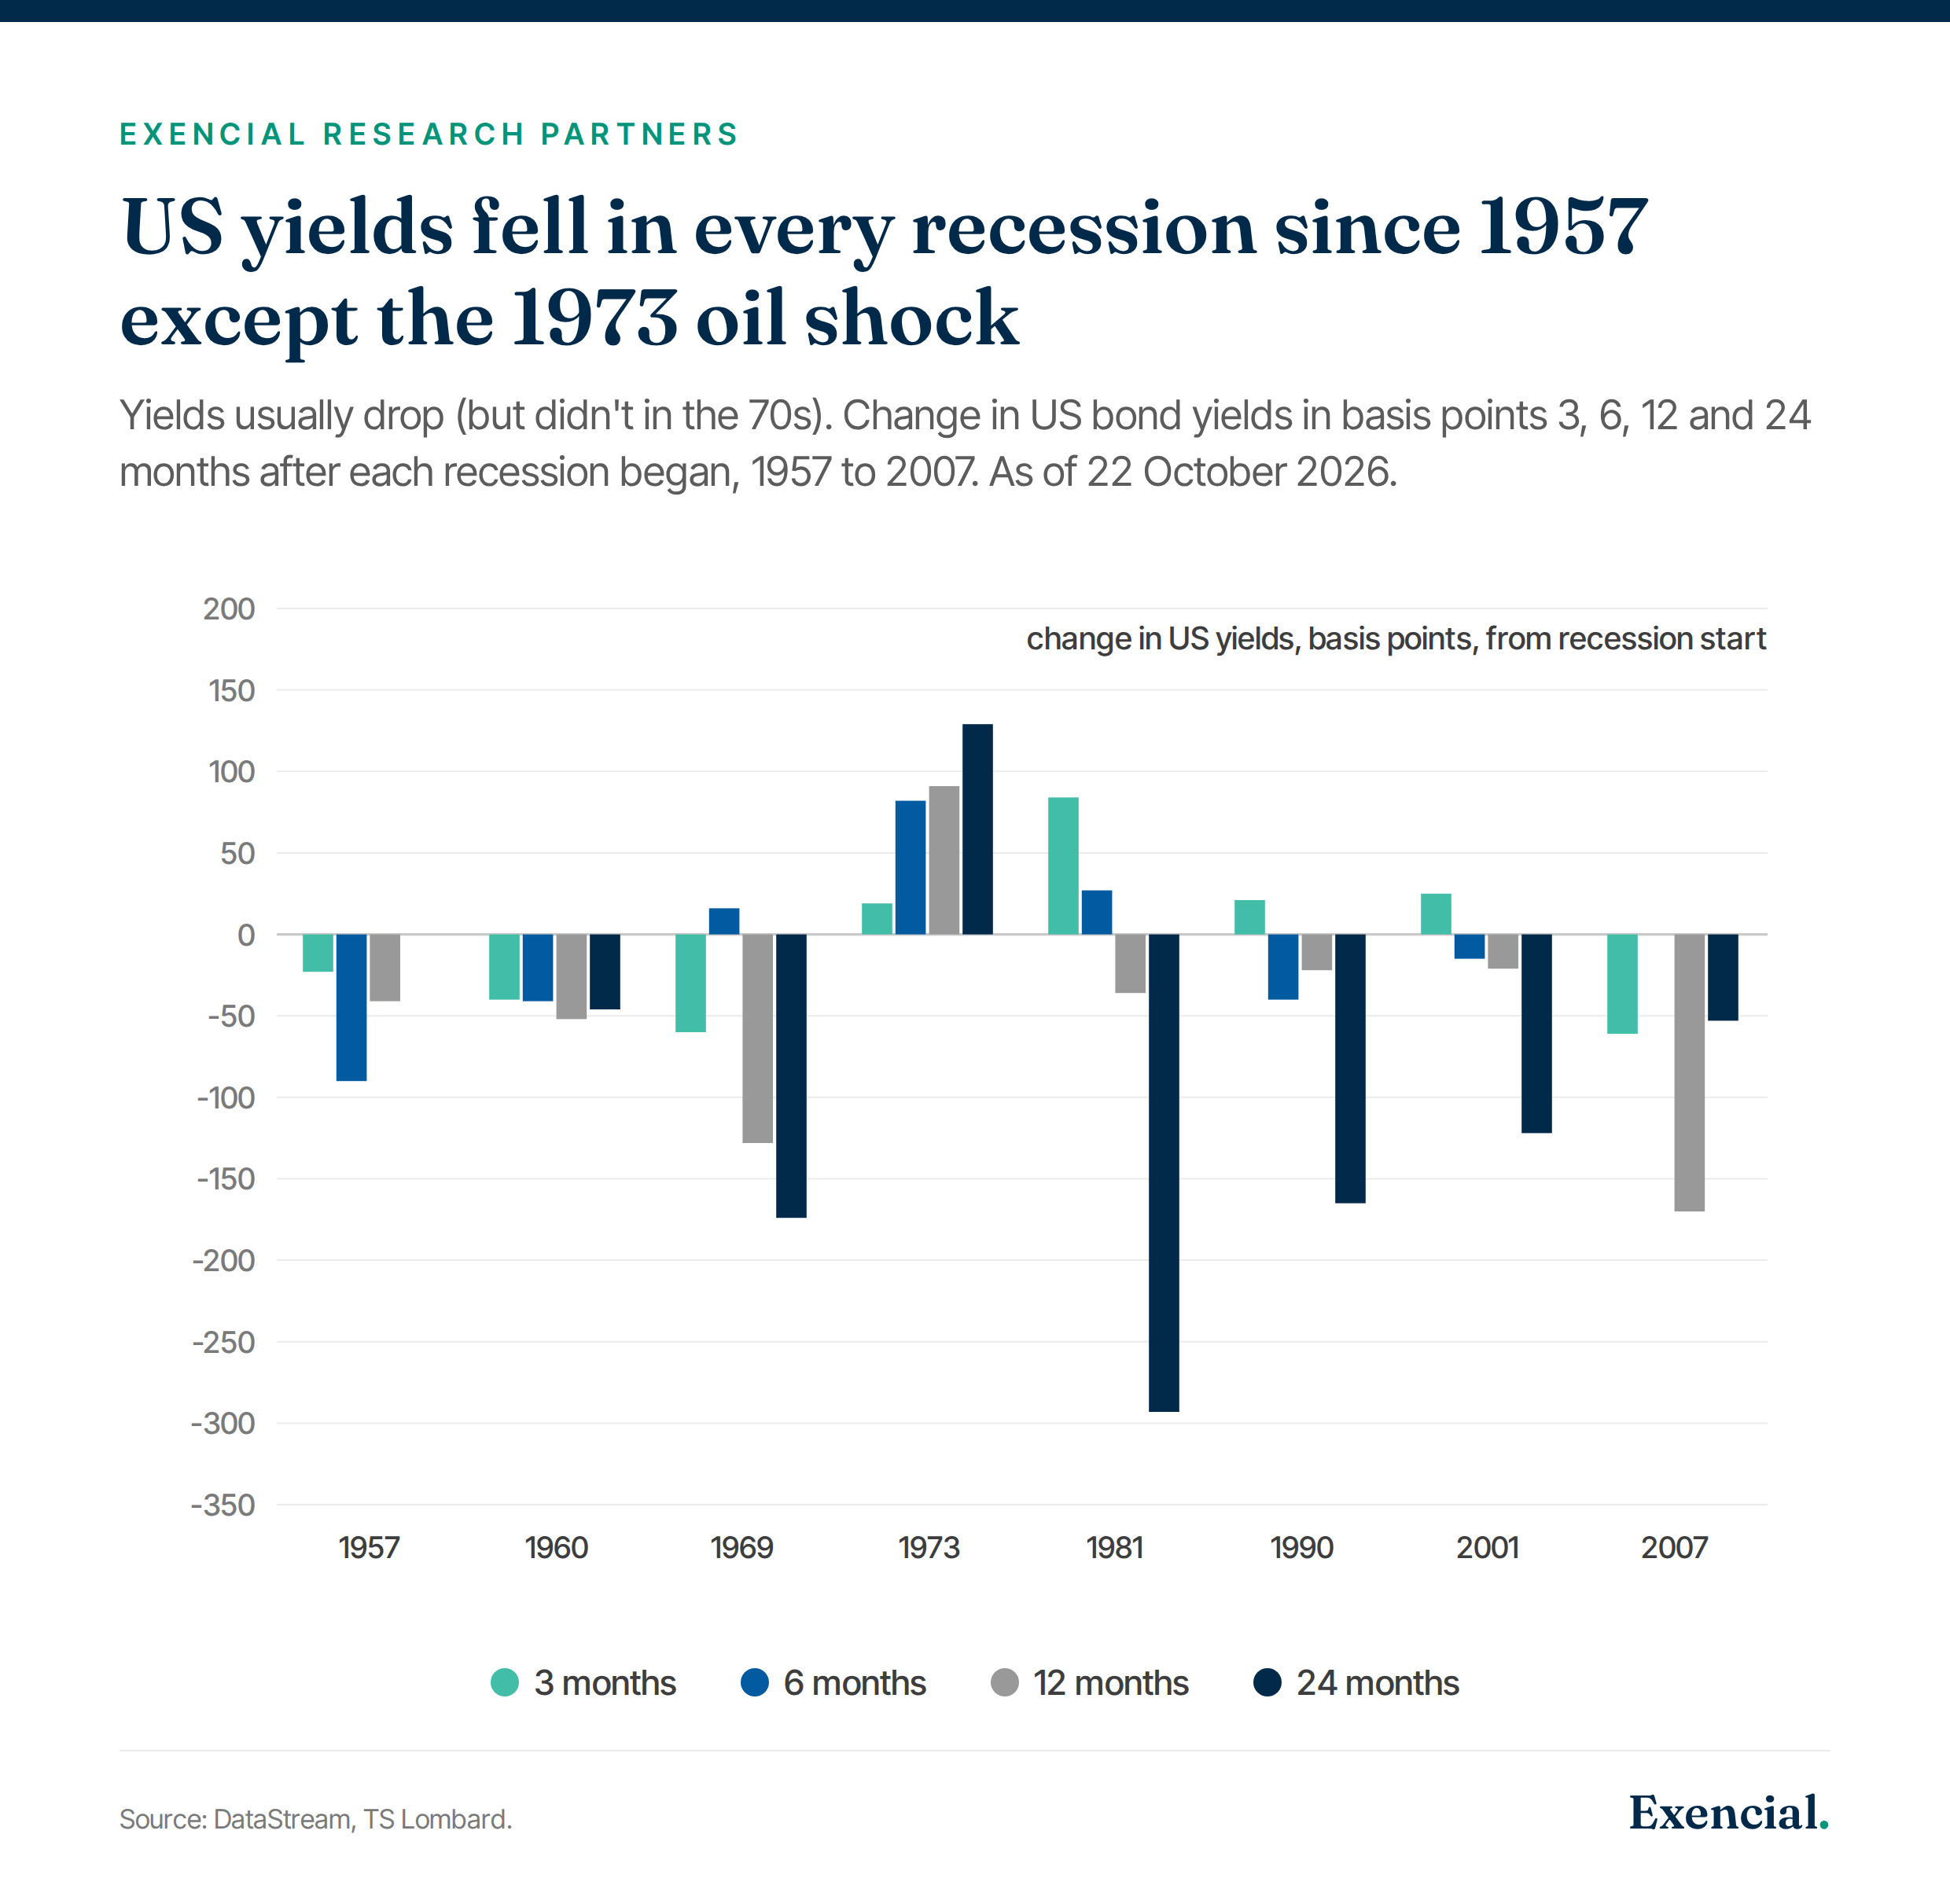
The bond call rests on history. The note counters the view that yields cannot fall in a downturn because inflation and deficits are too high. That view leans on the 1970s. TS Lombard’s chart shows US yields fell in seven of eight recessions since 1957. The exception was 1973, when yields rose about 130 basis points over two years because an oil shock caused the recession. An AI crash is a demand shock, which lowers both growth and inflation. That is when bonds work. TS Lombard expects long rates to fall a lot, but with no return to zero rates or permanent QE.
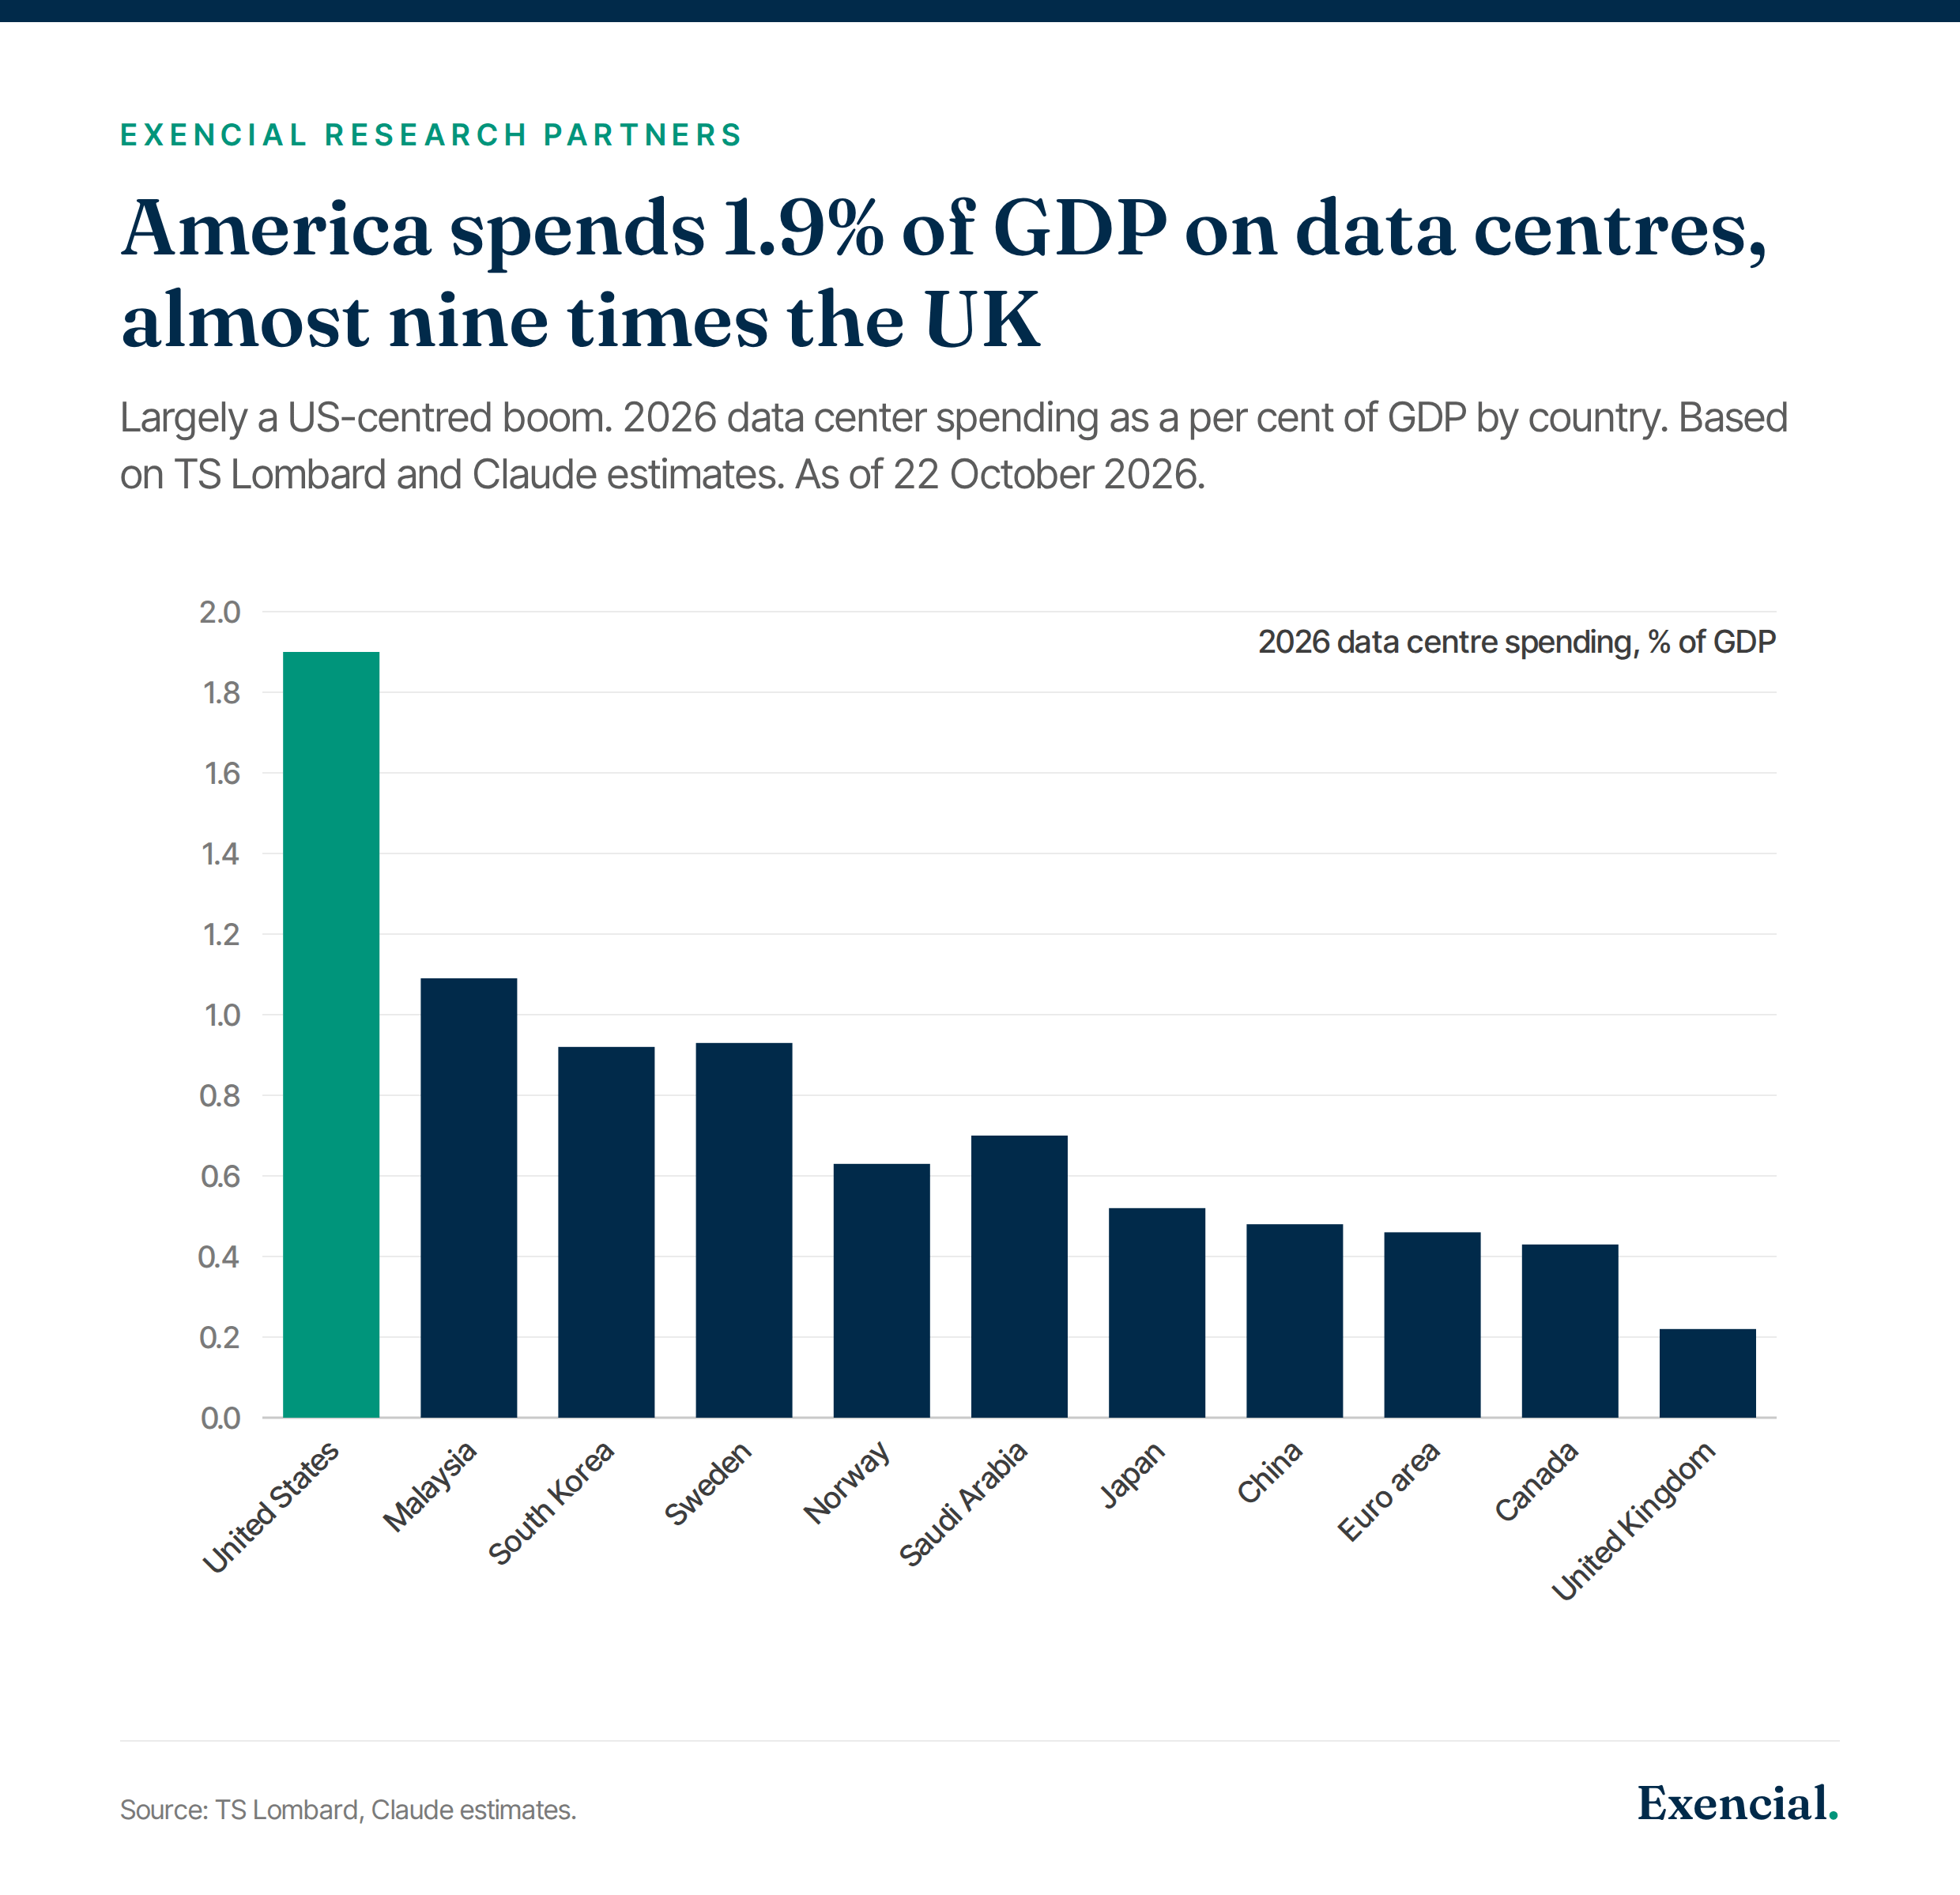
The reason non-US stocks should outperform is concentration. The US spends about 1.9% of GDP on data centres in 2026. Malaysia is next at 1.1%, Korea and Sweden near 0.9%, and the UK at the bottom at 0.2%. Dotcom was a global boom in which Europe’s tech share rose as much as America’s. This boom is American and Asian. Korea and Taiwan are the exposed economies, with tech exports adding 10 to 30 points of GDP in the past year. Europe barely took part, so Europe has less to lose. The dollar follows the same logic. In 2000 the dollar held up for 18 months after the peak because every major economy was in the bubble. This time the damage is centred on the US, so TS Lombard expects funds to move to the euro, the yen and possibly sterling.
The honest problem with “buy global stocks now” is that the first move in a crash is indiscriminate. TS Lombard says so. Everything sells off together before markets separate the exposed from the unexposed. Outperformance is a story for the months after the shock, not the week of it.
What could make this worse than TS Lombard expects?
The note names three risks to its own mild case, and the third is the one it worries about most.
The first is confidence. The US labour market is in balance, so companies have no reason to hoard workers. Once layoffs start, lower spending cuts profits, which brings more layoffs. In the last recession scare, labour shortages gave firms a reason to hold staff. That cushion is gone.
The second is timing. Early 2028 is a working assumption. If the boom runs to 2029, the debt stock is bigger, the hidden liabilities are bigger, and the credit loss maths changes.
The third is AI automation. Earlier this year TS Lombard dismissed the “Citrini-style doom loop”, in which companies automate their workforce to protect margins. The note now admits the incentive to cut costs is strongest when demand is weak. Much internet-era automation waited until 2009. Much of the China shock landed in the 2001 recession. If an AI crash pushes firms to automate, the recovery could be slow and jobless even if the downturn is shallow. Office support employment is already down from about 21 million in 2000 to around 16 million.
The floor under the whole analysis is the private sector balance sheet. If debt ratios stay near 165% of GDP and the stress stays inside the AI ecosystem, the 1990 or 2001 comparison holds. If a hyperscaler’s hidden leases or a bank’s exposure to GPU-backed loans proves larger than assumed, the comparison breaks.
This column summarises third-party research published by TS Lombard, part of GlobalData. Exencial Research Partners did not produce the underlying analysis and holds no position in the securities or scenarios discussed.