

Guidance Adherence - PGEL
Strong
Executive Summary: Guidance and Execution Profile
PG Electroplast Ltd (PGEL) demonstrates a strong track record of execution, characterized by a consistent pattern of underpromising and significantly overdelivering. Management provides quantitative “floors” for revenue and profitability, which they historically exceed by substantial margins. While the company is currently navigating significant seasonal and industry headwinds in the Room Air Conditioner (RAC) segment during FY 2025-2026, management’s transparency regarding inventory levels and commodity pass-through mechanisms maintains high credibility.
1. Current Cycle Performance: Q3 FY 2025-2026 Analysis
As of the latest reporting period (Q3 FY 2025-2026), the company is maintaining its ambitious full-year guidance despite a volatile environment for cooling products.
FY 2025-2026 Guidance Stability: Management has maintained its consolidated sales guidance of ₹5,700 - ₹5,800 crores and a net profit guidance of ₹300 - ₹310 crores.
Execution Momentum: In the first nine months (9MFY26), consolidated revenues grew 20.7% to ₹3,571.35 crores. The Room AC business, a critical driver, grew 27% during this period.
Seasonality and Risk Management: Management acknowledged high industry inventory levels (estimated at 5 million units across brands/channels) due to a slow off-season. However, they expressed confidence in achieving the target, citing that Q4 is typically the strongest quarter (last year Q4 contributed ₹146 crores out of ₹290 crores total PAT).
Management Commentary: “We stand by our guidance, and we think that we should be able to reach INR 5,700 crores to INR 5,800 crores sales for the full year” (Pramod Gupta, CFO, Q3 FY26).
2. Historical Accuracy Assessment (FY 2023 - FY 2025)
The company’s credibility is anchored in its performance over the last three fiscal years, where actual results frequently eclipsed initial projections.
FY 2024-2025: Exceptional Outperformance
Revenue Guidance: Guided for “at least” ₹3,650 crores (Group revenue ₹4,250 crores).
Actual Revenue: Achieved ₹4,870 crores (Group revenue ₹5,414 crores). This represents a massive 33% beat over the guided revenue floor.
Profitability Guidance: Guided for ₹216 crores in Net Profit.
Actual Profitability: Achieved ₹291 crores, a 35% beat.
FY 2023-2024: Resilience Amidst Deflation
Revenue Guidance: Guided for ₹2,800 crores.
Actual Revenue: Achieved ₹2,746.5 crores.
Forensic Note: While slightly below the numerical floor (~2% variance), management provided clear evidence that Average Selling Prices (ASPs) declined by 5-11% due to lower commodity prices (Plastic -12%, Copper -8%). On a volume basis, the company outperformed, demonstrating that the revenue “miss” was a function of the BOM (Bill of Materials) pass-through model rather than an execution failure.
FY 2022-2023: Upward Revisions and Beats
Original Guidance: Guided for ₹1,800 crores revenue and ₹126 crores operating profit.
Revised Guidance (Q3): Increased to ₹2,000 crores revenue and ₹140 crores operating profit.
Actual Results: Surpassed even the revised targets, achieving ₹2,147.8 crores in sales and ₹176 crores in operating profit.
3. Management Credibility and Forensic Red Flags
Positive Credibility Factors
Transparency on Headwinds: Management was remarkably candid in Q1 FY 2025-2026 when an early monsoon hit AC demand. They admitted, “In hindsight, we were not fully prepared for that kind of shift in this quarter” (Vishal Gupta, MD Finance, Q1 FY26).
Conservative Reporting: Management maintains a “conversion cost” fixed model, which limits their exposure to commodity volatility, though it makes top-line revenue sensitive to RM price fluctuations.
Asset Sweat Strategy: Management consistently guides for improving Fixed Asset Turns, targeting a turn of 4x to 5x on a fully operational basis.
Identified Risks & Patterns (Red Flags)
Inventory Buildup: A recurring theme is the high inventory levels during seasonal shifts. In Q1 FY26, inventory reached ₹1,400 crores. Management dismisses obsolescence risk (claiming <0.3% risk due to component commonality across star ratings), but the working capital drag remains a concern for cash flow.
Negative Operating Leverage: In Q2 FY26, operating margins softened significantly due to the RAC business decline. Management effectively communicated that this was due to negative operating leverage and supply cost increases, rather than structural margin erosion.
Dependence on China: Management has acknowledged significant dependence on Chinese import kits for RAC manufacturing (Value addition is currently 40-45%, with a goal of 70-75% in 2-3 years).
4. Forward-Looking Strategic Alignment
Management’s guidance for FY 2026-2027 involves a significant shift toward the refrigerator segment and geographical diversification.
Capex Integrity: Management is executing a ₹700-750 crore Capex plan for FY26, including a new refrigerator campus in South India and washing machine capacity in Greater Noida.
ODM Shift: The strategy to move from OEM to ODM (Original Design Manufacturer) is progressing well, with the Washing Machine business already 100% ODM and RAC reaching 80% ODM share in some periods. This shift supports the long-term goal of gradual margin improvement.
Final Assessment Table
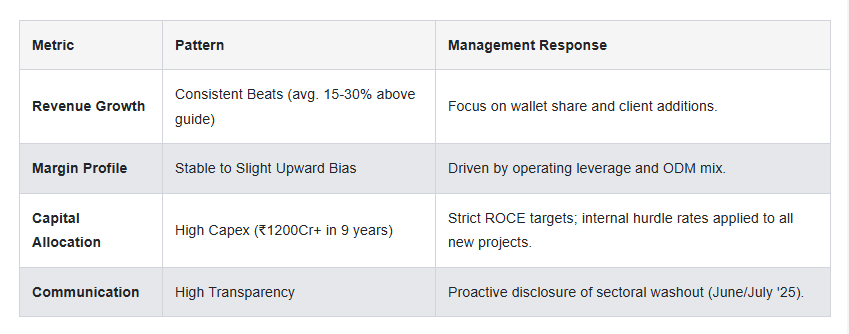
Conclusion: PGEL Management maintains strong credibility. They provide clear, conservative financial frameworks and have a proven history of meeting or exceeding these targets even when facing unseasonal weather patterns and commodity-driven ASP fluctuations.
Financial Reporting Standards - PGEL
Strong
Forensic Financial Analysis Report: PG Electroplast Ltd.
1. Executive Summary of Reporting Quality
PG Electroplast Ltd. exhibits a Strong level of financial reporting and transparency. The company provides a granular breakdown of its business segments (AC, Washing Machines, Plastic Moulding) and is notably transparent regarding external headwinds, such as unseasonal weather and channel inventory levels. While the company faces significant operational pressures in FY 2025-2026—specifically regarding inventory bloat and margin compression—the management’s commentary in concalls consistently aligns with the reported numbers, providing a clear narrative of the business cycle.
2. Revenue & Earnings Quality: A Story of Growth vs. Margin Pressure
Q3 FY 2025-2026: Volume Recovery but Margin Dilution
The latest quarter (Q3 FY 2025-2026) showed a significant rebound in sales, with Consolidated Revenue increasing 45.9% YoY to INR 1,412.1 Crores. However, a forensic look at the cost structure reveals a red flag:
Cost of Raw Material (CORM): Increased to 81.9% of operating revenues (up from 78.5% in Q3 FY 2025).
Gross Contribution Margin: This led to a contraction in Gross Contribution from 21.5% to 18.2%.
EBITDA Margin: Softened to 8.9% (vs 9.5% YoY), indicating that higher volumes are not translating into better unit economics, likely due to a change in the product mix and rising input costs.
FY 2024-2025: The “Landmark” Year
Management correctly characterized FY 2024-2025 as a period of exceptional execution.
Revenue Growth: 77.3% growth to INR 4,869.53 Crores, despite Average Selling Prices (ASPs) declining by up to 8% in some categories (Q4 FY 2024-2025).
Operating Leverage: The company benefited from significant operating leverage as the Bhiwadi AC unit ramped up, which helped margins improve YoY during that period.
Historical Accounting Shifts
An important observation is the company’s shift in accounting policy in FY 2022-2023, where Forex losses (previously exceptional) were reclassified as operational expenses. While this initially pressured reported operating margins (e.g., a INR 5 Crore hit in 1H FY 2023), it represents a more conservative and realistic reporting of recurring operational costs.
3. Operational Scrutiny: The Inventory and Working Capital “Red Flag”
Inventory Bloat in FY 2025-2026
The primary red flag for investors is the surge in inventory and the corresponding impact on cash flows.
Q3 FY 2025-2026: Inventory stands at INR 1,280 Crores. Management defends this by stating INR 1,160 Crores is Raw Material, with only INR 120 Crores in Finished Goods.
Q2 FY 2025-2026: Management was remarkably candid about channel inventory, estimating it at 1.5 to 2 million units across the industry due to an early monsoon and GST rate cut rumors.
Strategic Stocking: In Q4 FY 2024-2025, management admitted to “consciously keeping higher inventory of compressors” due to BIS-related uncertainty regarding Chinese suppliers. This strategic move explains the persistent high inventory levels but ties up significant working capital.
Elongation of Cash Conversion Cycle
Working capital metrics have deteriorated over the last year:
Average Receivable Days: Increased to 63.6 days (Dec ‘25) from 47.1 days (Dec ‘24).
Average Inventory Days: Increased to 94.8 days from 82.1 days YoY.
Cash Conversion Cycle: Elongated to 68.96 days (Dec ‘25) compared to 54.29 days (Dec ‘24).
This trend suggests that while the company is scaling, it is doing so at the cost of liquidity, requiring close monitoring of future collections.
4. Balance Sheet Quality & Capital Allocation
Deleveraging through Equity
The company’s balance sheet underwent a significant transformation in FY 2024-2025 due to a Qualified Institutional Placement (QIP) of INR 1,500 Crores.
Net Debt: Turned negative (INR -677.73 Crores as of March 2025), a massive improvement from the high debt levels seen in FY 2021-2022.
Net Debt/Equity: Remained at a healthy 0.03 in Dec 2025, despite the increase in gross debt to INR 561.8 Crores to fund working capital.
Aggressive Capex and New Verticals
Refrigerator Entry: A major strategic shift is the entry into Refrigerators, with a new facility in Sricity (MoU for INR 1,000 Crores). Mass production is expected in 12-14 months (Q1 FY 2025-2026 commentary).
Asset Sweating: Fixed Asset Turns have remained robust at 5.08x to 6.03x, indicating that management is successfully sweating its assets even as it expands capacity.
5. Management Commentary & Disclosure Quality
Transparency: Management provides very specific industry insights. For example, in Q3 FY 2024-2025, they estimated PG’s market share as 1.2 units manufactured for every 10 sold in India.
Customer Concentration: A persistent risk is that the Top 5 clients contribute 50% to 60% of revenue (Q3 FY 2024-2025). While management lists a wide array of logos (Blue Star, Voltas, LG, etc.), the revenue is heavily skewed toward these few.
Seasonality Awareness: Management consistently warns about the “seasonal nature” of the AC business, which typically concentrates production in January-May (Q3 FY 2023-2024).
6. Red Flags Summary for Investors
Margin Dilution: Rising raw material costs (CORM) as a percentage of sales in the latest quarter suggest pricing pressure from brands.
High Working Capital Intensity: Inventory levels of INR 1,280 Cr and rising receivable days are straining operating cash flows.
Dependence on Weather: The FY 2025-2026 performance has been a victim of the “early monsoon,” highlighting the vulnerability of the primary revenue driver (RAC) to climate fluctuations.
Heavy Capex Commitments: With ongoing expansions in Supa, Bhiwadi, and Sricity, any delay in the refrigerator ramp-up could lead to negative operating leverage.
Final Verdict: PG Electroplast is a high-growth company with strong disclosure practices. However, the recent spike in working capital and the contraction in gross margins in the latest quarter (Q3 FY 2026) necessitate a cautious outlook regarding near-term profitability.
Management Responses Check - PGEL
Strong
Management & Credibility Analysis: PG Electroplast Ltd.
PG Electroplast Ltd.’s management has demonstrated a high degree of transparency and operational control, particularly when navigating the extreme volatility of the cooling products industry. While the company has moved from a phase of hyper-growth in FY 2024-2025 to a “cautious” stance in the current FY 2025-2026, the leadership has remained consistent in its strategic focus on capital efficiency and backward integration.
1. Consistency of Tone & Sentiment: From Hyper-Growth to Cautious Resilience
The management’s tone has shifted logically with market conditions, moving from extreme optimism during the “heatwave” driven FY 2024-2025 to a more measured, cautionary tone in the current fiscal year.
Current Caution (Q3 FY 2025-2026): Management has adopted a cautionary but transparent tone regarding the industry-wide inventory glut. Pramod Gupta (CFO) acknowledged that “industry inventory levels for Room Air Conditioners (RACs) are high, estimated at around 5 million units across brands and channels” due to slow off-season sales despite the GST cut.
Challenging Navigations (Q1 & Q2 FY 2025-2026): The tone turned sober early in the year due to weather anomalies. In Q1 FY 2025-2026, management described the period as a “challenging start” with Vishal Gupta (MD) noting that “June was a total washout for most of the brands.” By Q2 FY 2025-2026, they admitted performance was “lower than expected” due to GST rate cut expectations delaying purchases.
The Peak Optimism (FY 2024-2025): Throughout the previous year, the sentiment was exceptionally bullish. In Q1 FY 2024-2025, management highlighted that the “whole industry has done extremely well” with RAC sales growth of 40-50% across the board.
Historical Resilience (FY 2023-2024): Even when Q3 FY 2023-2024 saw AC sales drop 5% YoY due to inventory corrections, management remained confident and grounded, correctly predicting a recovery in Q4 based on underlying demand rather than just channel filling.
2. Q&A Insights: Transparency vs. Strategic Non-Disclosure
The management is generally forthcoming with financial explanations, though they have recently tightened disclosures on operational volumes.
Metric Omission (Red Flag): Starting in Q3 FY 2023-2024, management officially stopped sharing specific volume data for RAC (Indoor Units/Outdoor Units) and Washing Machines. Pramod Gupta (CFO) stated, “That data we have stopped giving and we don’t share for the competitive reason.” This is a slight negative for forensic analysts who use volume-mix analysis to verify revenue quality.
Proactive Margin Explanation: In Q3 FY 2025-2026, management provided a very technical and credible explanation for margin pressure, attributing a 120-150 bps impact to the SAP migration. They explained that the new ERP reclassified certain raw materials from ‘consumables’ (Other Expenses) to COGS, impacting the Gross Contribution optics.
Inventory Clarity: Management has been very specific in defending their balance sheet. In Q3 FY 2025-2026, they broke down the INR 1,280 crore inventory, clarifying that INR 1,160 crore was raw material and only INR 120 crore was finished goods, thus minimizing concerns about obsolescence or “dumping” in the channel.
Client Concentration: While they do not provide a brand-wise revenue split, they are honest about concentration. In Q3 FY 2024-2025, they disclosed that the “Top 5 clients in both AC and washing machine will be probably contributing close to 50% to 60% of the revenue.”
3. Management Credibility & Execution Track Record
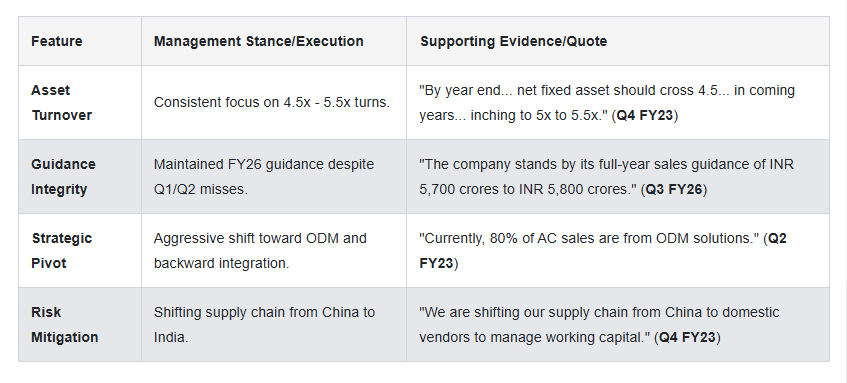
The leadership team, led by Vishal Gupta and Pramod Gupta, has shown significant continuity, with no major executive turnover reported in the retrieved context. Their credibility is bolstered by a “say-do” ratio that remains high.
Overall Assessment
PG Electroplast’s management is rated as “Strong.” They have successfully scaled the business from a sub-INR 300 crore revenue base in FY16 to nearly INR 5,000 crore in FY25. Their credibility is supported by:
Detailed and logical explanations for financial variances (e.g., SAP migration impact, commodity pass-through mechanisms).
Consistency in leadership and a clear, multi-year strategy involving backward integration and ODM expansion.
Honesty regarding industry headwinds, such as the “washout” in June and the current 5-million-unit inventory surplus in the industry.
The only minor concern remains the stoppage of volume disclosure, which reduces the granularity available to investors for verifying market share claims. However, their willingness to provide “offline” data and detailed inventory breakdowns mitigates this risk significantly.
Capital Allocation Strategies - PGEL
Strong
Executive Summary: The Growth-Efficiency Balancing Act
PG Electroplast Ltd (PGEL) has transitioned from a plastic components manufacturer to a major Original Design Manufacturer (ODM) powerhouse in the Indian consumer durables space. The company’s financial narrative from Q3 FY 2025-26 back to FY 2022-23 is one of aggressive capacity expansion funded by a massive strategic equity infusion, resulting in high growth but a temporary compression in return ratios as capital is “sweated.”
1. Capital Allocation & ROI: Aggressive Expansion with Clear Benchmarks
The company has demonstrated a consistent strategy of reinvesting cash into high-growth product segments (Room ACs and Washing Machines) while maintaining a strict internal hurdle rate for new projects.
Current Status (Q3 FY 2025-26):
Management is currently executing a massive INR 750 crore Capex plan. The breakdown is highly transparent:
INR 300 crores: Dedicated to a new refrigerator facility in Sricity (South India), expected to be operational in Q4 FY 2026-27.
INR 200 crores: Washing machine capacity and a new campus in Greater Noida.
INR 84 crores: Strategic land acquisition (72 acres) in Supa.
Management Insight (Q3 FY 2026):
“We do not tend to actually go overboard on the inorganic initiatives... our capital efficiency remains very key to our capital allocation decisions... we target an asset turn of about 4x on a fully operational basis.”
Historical ROI Performance:
While the company targets high returns, the massive influx of capital has led to a temporary dip in efficiency ratios as the new plants are in the commissioning phase.
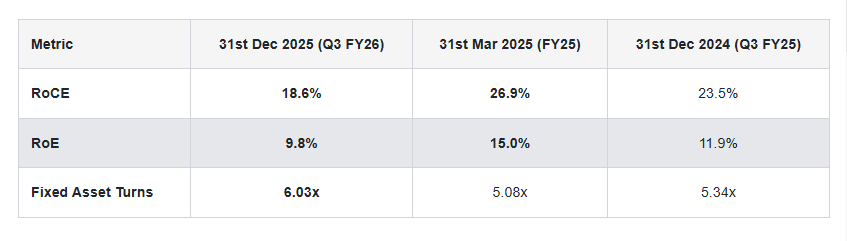
Red Flag Observation: The RoCE has compressed from 26.9% to 18.6% year-over-year. This is primarily due to the “Capital Employed” increasing from INR 2,150.5 Cr (Mar ‘25) to INR 3,053.8 Cr (Dec ‘25) without the new capacities yet contributing to EBIT.
2. Balance Sheet Health & Leverage: Transformed by Equity
The balance sheet underwent a paradigm shift in FY 2024-25 when the company raised substantial equity, moving from a leveraged position to a net-cash/low-debt profile.
Debt Dynamics (Q3 FY 2025-26):
Gross Debt: Increased to INR 561.8 Cr (Dec ‘25) from INR 301.9 Cr (Mar ‘25) to fund ongoing capex.
Liquidity: Cash and Bank balances stood at INR 482.9 Cr (Dec ‘25), resulting in a Net Debt of only INR 78.9 Cr.
Net Debt/Equity: Remained exceptionally low at 0.03x in Q3 FY26.
Evolution of Stability: In Q4 FY 2023-24, the company reported a net cash position of INR 180 Cr, showing a disciplined recovery from earlier years. Management stated in Q2 FY 2024-25 that they “will maintain those capital efficiency norms” and avoid projects that do not significantly exceed the cost of capital.
3. Cash Flow Dynamics & Working Capital: The Seasonality Struggle
Forensically, the biggest “red flag” or area of concern for PGEL is the volatility in working capital, specifically inventory management linked to the Room AC business.
Working Capital Trends (Q3 FY 2025-26):
Inventory Build-up: Inventories rose to INR 1,279.3 Cr in Dec ‘25 compared to INR 1,025.9 Cr a year prior.
Cash Conversion Cycle (CCC): The CCC elongated to 68.96 days (Dec ‘25) from 49.91 days (Mar ‘25).
Receivable Stretch: Average Receivable Days increased to 63.6 days in Dec ‘25 vs 47.1 days in Dec ‘24.
Management Justification (Q3 FY 2026): Regarding the build-up of ~INR 1,100 Cr in inventory, management clarified:
“January, February, and March are typically the peak manufacturing months... the AC division inventory was reduced by almost 8% this quarter... current inventory is normal given our capacity to produce 4.25 lakh finished ACs.”
Operating Cash Flow (OCF):
While the company reports that OCF remains “strong” across most quarters (e.g., Q2 FY2025 and Q4 FY2025), the Q1 FY 2025-26 period saw OCF negatively impacted by higher inventory levels due to a “challenging start” and early monsoon affecting AC sales.
4. Fundraising & Execution: Strategic vs. Emergency
Unlike companies that raise capital due to distress, PGEL’s fundraising has been strictly for capacity building.
FY 2024-25 (9MFY25 Highlights): The company successfully raised INR 1,500 crores of equity. This was the primary driver for strengthening the balance sheet and funding the Sricity and Bhiwadi expansions.
Cumulative Investment: Over the last 9 years, the company has deployed over INR 1,200 Crores in Capex, moving from a revenue of INR 263 Cr (FY16) to INR 4,905 Cr (FY25)—an 18x growth.
Assessment of Financial Stability & Red Flags
Positives:
Revenue Growth: A staggering 38.5% CAGR over 9 years, supported by a 42.6% EBITDA CAGR.
Prudent Leverage: Successful transition to a low-leverage model (Net Debt/Equity of 0.03x) through equity raises rather than debt-heavy expansion.
Capacity Visibility: Capex is on track; the Bhiwadi and Supa AC units are in the final stages of commissioning as of Q3 FY26.
Red Flags for Investors:
Return Ratio Compression: RoCE and RoE have dipped significantly in FY26. Investors must watch if these ratios bounce back to the 25%+ range once the Sricity and Greater Noida plants go live.
Inventory Risks: The company is carrying high inventory (INR 1,279 Cr). Any softer-than-expected summer season could lead to significant liquidity pressure and negative operating leverage.
Customer Concentration/Outsourcing Trends: The business depends on the “Outsourcing” trend. While management notes outsourcing is 2-4% cheaper for brands, any shift by major brands to in-house manufacturing (due to PLI benefits) remains a long-term threat.
Final Verdict: PGEL is in a hyper-growth phase. While return ratios are currently diluted by a large capital base, the management’s focus on cost leadership and 4x asset turns provides a credible roadmap for long-term value creation.
Operations & Strategies Execution - PGEL
Strong
Operational & Strategic Analysis: PG Electroplast Ltd. (PGEL)
PG Electroplast has demonstrated a consistent trajectory of scaling operations and transitioning from a pure-play plastic molding company to a diversified Original Design Manufacturer (ODM). The company’s operational track record is characterized by aggressive capacity expansion, strategic backward integration, and a focus on cost leadership.
1. Historical Operational Progression (FY 2022-23 to FY 2025-26)
FY 2022-2023: The company focused on sweating its assets, particularly the Supa plant, which is described as one of the most backward-integrated AC manufacturing facilities in India. Management emphasized a shift toward asset turnover (targeting 4.5x) and cost leadership. By Q2 FY23, AC sales reached a then-record INR 250 crores, with Washing Machines (WM) growing 271% YoY.
FY 2023-2024: Despite unseasonal rains affecting Q1 and Q2 demand, PGEL achieved 27.2% consolidated revenue growth for the full year. A significant milestone was the window AC expansion (300,000 unit capacity) and the commissioning of the Bhiwadi AC unit. The company moved to a net cash positive position following a QIP, strengthening the balance sheet for further expansion.
FY 2024-2025: This was a year of “Exceptional Growth,” with revenues surging 77.3% to INR 4,869.53 crores. The AC business alone generated INR 3,009 crores (128.5% YoY growth). The company successfully raised INR 1,500 crores in equity to fund the next leg of growth, including the entry into the refrigerator segment.
FY 2025-2026 (Latest Quarter Q3): The company is currently managing a “Challenging Start” to the year due to seasonal demand shifts. However, for 9M FY26, consolidated revenues grew 20.7% to INR 3,571.35 crores. A major operational shift occurred with the SAP migration, which impacted reported margins but is expected to improve long-term governance.
2. Cost Structures & Operational Efficiency
Management maintains a disciplined approach to cost structures, utilizing a “pass-through” model for raw materials to mitigate commodity risk.
SAP Migration Impact: In Q3 FY2025-26, management confirmed margin pressure due to the migration to SAP. This resulted in a reclassification of certain raw materials from ‘consumables’ (Other Expenses) to COGS, impacting gross contribution margins by 120 basis points and AC margins by nearly 150 basis points (Concall Q3 FY26).
Backward Integration: The core strategy remains exhaustive backward integration. By producing components in-house (Plastic molding, PCB assemblies, heat exchangers), PGEL reduces logistics and packaging costs. Management stated in Q3 FY23: “The basic idea is to derive cost leadership... if you are making all components in-house... you are not spending money on packing and forwarding.”
Operating Leverage: While expenses like Finance Costs rose in Q1 FY26 (to 2.25% from 1.39% YoY), management utilizes operating leverage during peak seasons (Q4) to normalize margins.
3. Strategic Roadmap & New Initiatives
PGEL has a clear roadmap to establish three large manufacturing hubs (North, West, and South) to optimize logistics and asset utilization.
Refrigerator Entry: The most significant new initiative is the Sricity campus, which had its groundbreaking in 9M FY26. This facility will have a capacity of 1.2 million refrigerators, expected to be operational by Q4 FY27 (Concall Q3 FY26).
Capacity Expansion: All Capex for FY26 is on track, including INR 300 crores for the refrigerator plant and INR 200 crores for Washing Machine capacity and the Greater Noida campus, which is ready for commercial production.
ODM Transition: The company is successfully transitioning to an ODM model in Washing Machines (100% ODM) and ACs, which allows for better “per-piece margin” security compared to pure OEM.
4. Risk Management & Diversification
To counter overdependence on the highly seasonal Room AC segment (which contributed 73% of revenue in 9M FY26), management is diversifying its product and geographic footprint.
Product Diversification: Expansion into Refrigerators, Air Coolers, and LED TVs (via Goodworth JV), alongside emerging interests in POS devices and EV components, reduces reliance on summer-dependent sales.
Geographic De-risking: The move into Sricity (South India) adds a third geographic hub, mitigating the risk of regional demand fluctuations or supply chain disruptions in the North/West clusters.
Client Concentration: PGEL serves 70+ brands, ensuring that its growth is not tied to the success of a single market player. In Q3 FY24, management noted they are “securing new clients and expect continued high growth in the TV segment, exceeding 100% YoY.”
5. Organizational Continuity
There is no evidence of high leadership turnover in the retrieved reports. Instead, the focus has been on manpower recruitment to support new facilities.
Leadership Stability: The management team, led by the Guptas, has remained consistent, providing strategic continuity.
Talent Acquisition: In Q4 FY25, management noted: “The product team, the R&D team and the operations team... are already hired [for the refrigerator business].” This suggests proactive organizational planning for new business verticals.
Conclusion
PG Electroplast possesses a strong operational track record. While the company faces inherent seasonal risks and recent margin volatility due to ERP transitions, its ability to consistently beat guidance, successfully raise significant capital, and execute large-scale brownfield/greenfield expansions indicates high strategic execution capability. The transition toward a multi-hub, multi-product ODM model provides a robust foundation for medium-term growth.
Risk Management & External Factors - PGEL
Strong
PG Electroplast Ltd (PGEL) demonstrates a Strong risk management framework, characterized by high transparency regarding operational setbacks, a robust pass-through pricing model to mitigate commodity risks, and proactive capital management. While the company remains highly susceptible to weather-induced seasonality, management’s ability to maintain growth trajectories and deleverage the balance sheet through strategic equity raises is commendable.
1. Identifying Macro & Regulatory Red Flags
Management provides a realistic and often self-critical assessment of industry headwinds, particularly regarding the impact of climate on the cooling business.
FY 2022-2023: Management identified intense competition in the RAC industry, noting that certain brands were aggressively pursuing market share through pricing. PGEL’s response was a focus on service differentiation and cost leadership rather than participating in a “race to the bottom” on margins.
FY 2023-2024: The company faced significant headwinds from unseasonal rains in Q1 and Q2, which led to inventory pile-ups and a 5% YoY decline in AC sales by Q3 FY24. Management was transparent, attributing the underperformance to “demand destruction” caused by the weather (Q3 FY24 Concall).
FY 2024-2025: Despite massive revenue growth, management flagged a sharp decline in Average Selling Prices (ASPs) across all product categories (5-11%) due to falling commodity prices (Plastic -12%, Copper -8%).
FY 2025-2026: In the latest quarters, management acknowledged a “softer than expected” start to the year. The early monsoon in May/June 2025 led to a 70% decline in AC business for June and July. Management admitted, “In hindsight, we were not fully prepared for that kind of shift” (Q1 FY26 Concall). They also flagged a high system inventory of 5 million units in the RAC industry as a major macro concern (Q3 FY26 Concall).
2. Risk Mitigation Strategies
The company employs several structural strategies to insulate itself from volatility in interest rates, currency, and commodities.
Commodity & Currency Exposure: PGEL utilizes a pass-through model for the Bill of Materials (BOM). Management confirmed that per-unit conversion prices are fixed, and raw material fluctuations are passed to the customer with a lag of 10–30 days (Q1 FY25, Q3 FY26 Concalls). In Q2 FY23, management proactively changed its accounting policy to recognize forex losses as operational expenses to provide a clearer picture of operating margins.
Cost Control & Vertical Integration: To combat rising power costs, the company commissioned a 1.5 MW solar plant (Supa) meeting 40% of electricity demand and focused on backward integration to maintain cost leadership.
Geopolitical Risk: Management acknowledged import dependence on China as a general risk but is actively pursuing localization to reduce this vulnerability (Q1 FY24 Concall).
Financial Risk: To mitigate interest rate and debt risks, the company successfully raised INR 1500 crores via equity in 9M FY25, significantly strengthening the balance sheet and reducing net debt.
3. Pending Litigation or Investigations
Based on the provided reports and management commentary from Q1 FY23 to Q3 FY26, there is no mention of any pending litigation, investigations, or regulatory actions against the company. Management appears to maintain a focus on compliance and incentive filings (e.g., PLI and state government mega-project benefits).
4. Consistency in Risk Disclosures
Management has remained highly consistent in its narrative across the timeline, particularly regarding the following:
Seasonality: Every year, management reiterates that Q2 and Q3 are low seasons for AC manufacturing. They have consistently cautioned investors not to look at performance on a QoQ basis but on a YoY/trailing 12-month basis (Q2 FY25 Concall).
Asset Turnover Targets: Since Q3 FY23, management has consistently targeted a fixed asset turnover of 4.5x to 5.5x. By Q4 FY25, they successfully crossed the 5x mark, proving execution consistency.
Margin Focus: Management has shifted the narrative from “percentage margins” to “per-piece margins” and “asset throughput,” arguing that in a contract manufacturing setup, ROCE and capital efficiency are better risk indicators than volatile gross margins.
5. Appraisal of Preparedness and Vulnerability
Preparedness: PGEL is well-prepared for financial shocks. The INR 1500 crore fundraise provides a massive cushion against high interest rates or the need for emergency CAPEX. Their localization strategy (15% value addition and 55-60% domestic BOM) reduces exposure to global supply chain disruptions. The shift to SAP migration in Q3 FY26, while causing temporary margin reclassification (120-150 bps impact), indicates a move toward better internal controls and data integrity.
Vulnerabilities: The primary vulnerability remains the erratic weather patterns in India. The Q3 FY26 disclosure of 5.5 lakh units in PG’s own AC inventory and 5 million units in the total system suggests that despite diversification into Washing Machines (growing 40-45%), the company’s fortunes are still heavily tied to a “good summer.” If the 2026 summer is delayed, the high inventory could lead to significant working capital pressure.
Conclusion: Management earns a Strong rating for their transparent communication regarding errors (like the FY26 weather preparation) and their disciplined capital allocation (refusing projects that don’t meet ROCE targets). They have transitioned from a small-scale component maker to a credible OEM/ODM partner with a diversified client base (Voltas, Blue Star, Daikin, etc.), reducing client-specific risk.